Mastering Order Flow
Trading with Quantower
From Cluster charts to CVD divergences and advanced Volume Profile setups — the complete professional guide to Quantower order flow.
Why Professional Traders Choose Quantower for Order Flow
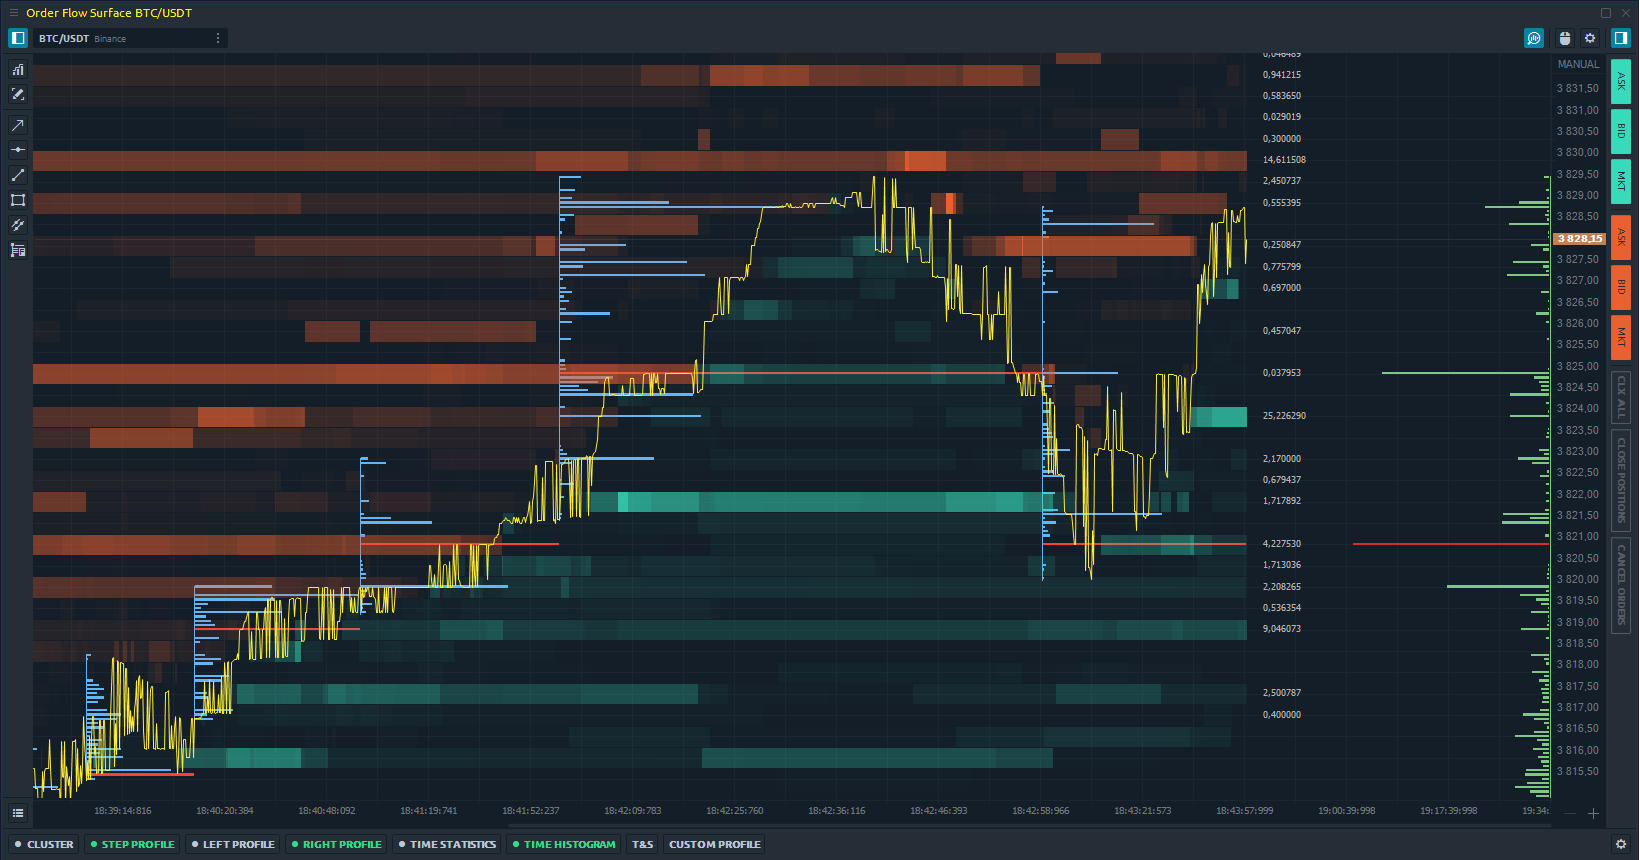
Order flow trading uncovers the genuine dynamics between buyers and sellers via real-time volume and executed orders at each price level. Quantower stands as a robust, accessible multi-asset platform offering professional-grade tools like Cluster (Footprint) charts, Volume Profiles, Order Flow Surface, and cumulative delta analysis.
It caters to futures, stocks, options, ETFs, and crypto with superior customization and efficiency.
Download the latest version (7-day premium trial): https://www.quantower.com/download
Beginner Level: Getting Started with Quantower
Installation and First Chart
Download the Windows application — no registration needed. Connect to over 60 data feeds (Rithmic, CQG, Binance, Interactive Brokers). Launch a chart and activate the Cluster Chart or Order Flow Surface panel.
Core Beginner Tools
- Smart DOM: Real-time order book depth visualization.
- Basic Volume Analysis: Essential metrics for initial insights.
- Simple Cluster Chart: With Delta coloring for easy interpretation.
Pro Tip for Beginners
Leverage the built-in Market Replay simulator for risk-free, tick-by-tick practice.
Official quick-start guide: https://help.quantower.com/quantower/getting-started
Intermediate Level: Footprint Charts and Imbalance Analysis
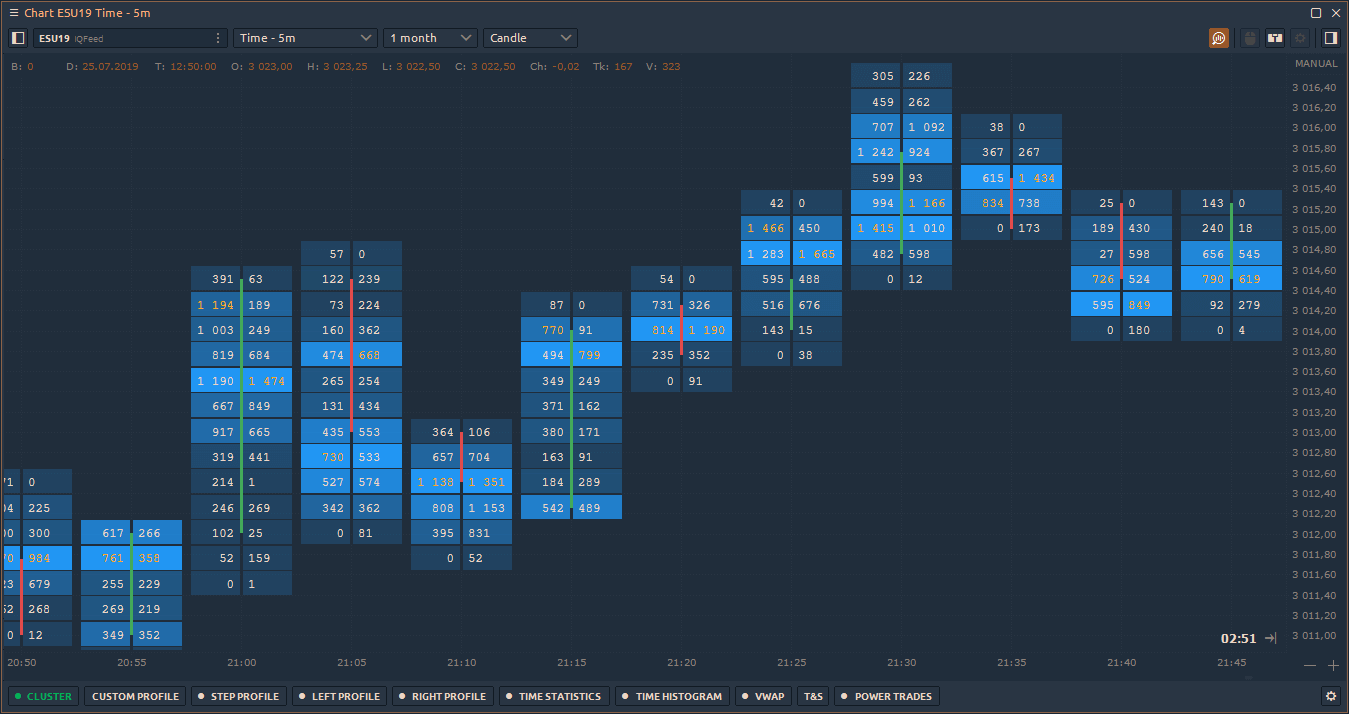
The Cluster Chart (Quantower's Footprint) dissects every candle into a detailed grid displaying Bid x Ask volume, Delta, and Imbalance.
Key Cluster Modes
- Single/Double cluster configurations.
- Delta-colored volume for visual clarity.
- Imbalance highlighting including stacked imbalances.
- Unfinished Auctions detection.
Recommended Settings
Chart Settings: Enable "Imbalance" (ratio 250-400%), select "Delta" coloring, activate histogram visualization.
Common Patterns to Master
- Absorption zones where volume spikes but price stalls.
- Delta divergence within bars.
- Stacked imbalances indicating potential acceleration.
Official Cluster Chart documentation: https://help.quantower.com/quantower/analytics-panels/chart/volume-analysis-tools/cluster-chart
Advanced Level: CVD, Divergences and Volume Profiles
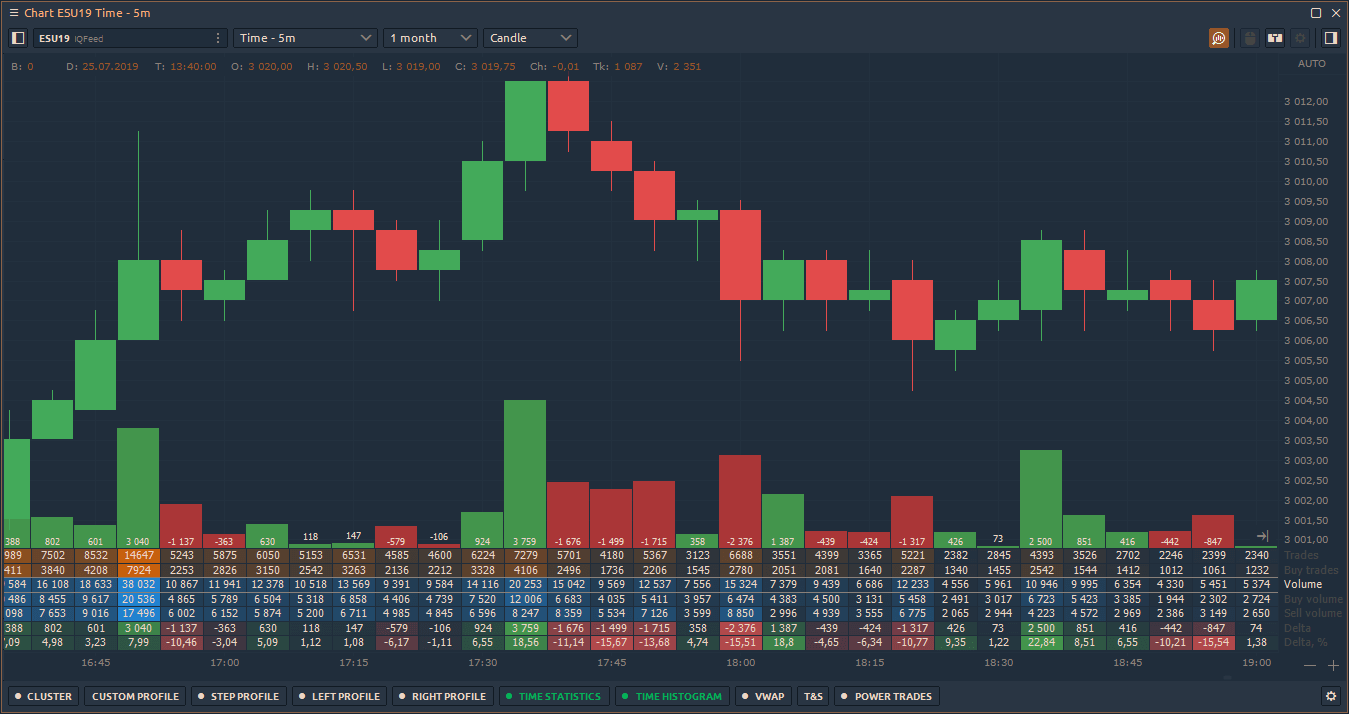
Cumulative Volume Delta (CVD)
Quantower delivers comprehensive CVD via the Time Statistics panel and custom indicators. Filter by trade size or employ bar-by-bar cumulative delta to identify precise divergences.
CVD Divergence Setups
- Bullish: Price forms a lower low while CVD creates a higher low (hidden buying pressure).
- Bearish: Price achieves a higher high but CVD forms a lower high (exhaustion).
Volume Profile Mastery
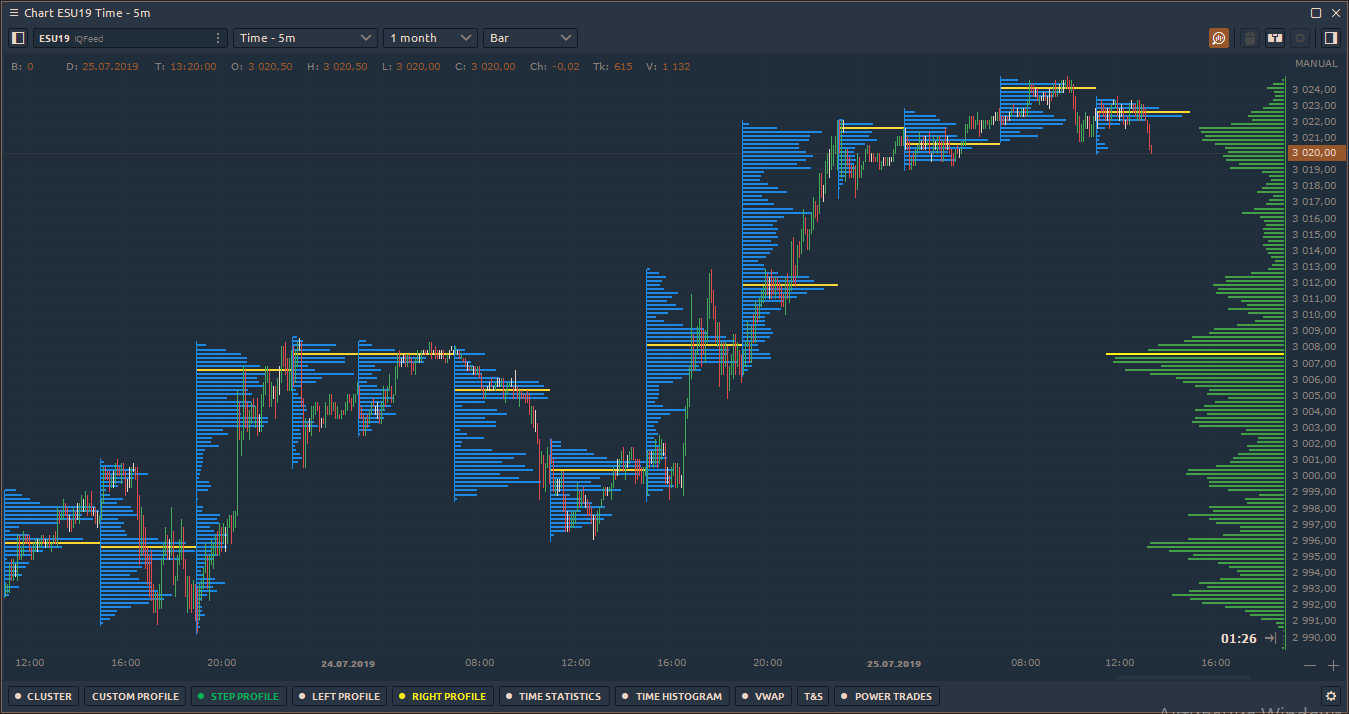
- Session, Visible Range, Fixed Range, and Composite profiles.
- Highlight Value Area, Point of Control (POC), and High-Volume Nodes.
Pro Workflow
Cluster Chart + Volume Profile + CVD line in a single workspace for full order flow confirmation.
Volume analysis guide: https://www.quantower.com/volumeanalysistools
Expert Settings and Strategy Optimization
Key Adjustments
- Enable "By Delta" coloring on profiles for enhanced readability.
- Activate unfinished auction detection to spot market inefficiencies.
- Incorporate Delta Rotation and Power Trades indicators.
- Design custom workspaces with Order Flow Surface + Liquidity Map.
Advanced Example
Footprint + stacked imbalance at POC + CVD divergence = high-probability reversal setup.
Optimization Tools
Utilize Market Replay and built-in statistics to backtest and refine strategies rigorously.
Conclusion and Next Steps
Quantower converts intricate order flow data into actionable, clear insights suitable for traders at every level. Beginners value its user-friendly interface, while advanced users appreciate the extensive depth and multi-asset compatibility.
Download Quantower today: https://www.quantower.com/download
Full documentation: https://help.quantower.com/
Further Reading and Resources