Mastering Order Flow
Trading with ATAS
From Smart DOM to CVD Pro divergences and institutional Volume Profile setups — the complete professional guide to ATAS order flow.
Why Professional Traders Choose ATAS for Order Flow
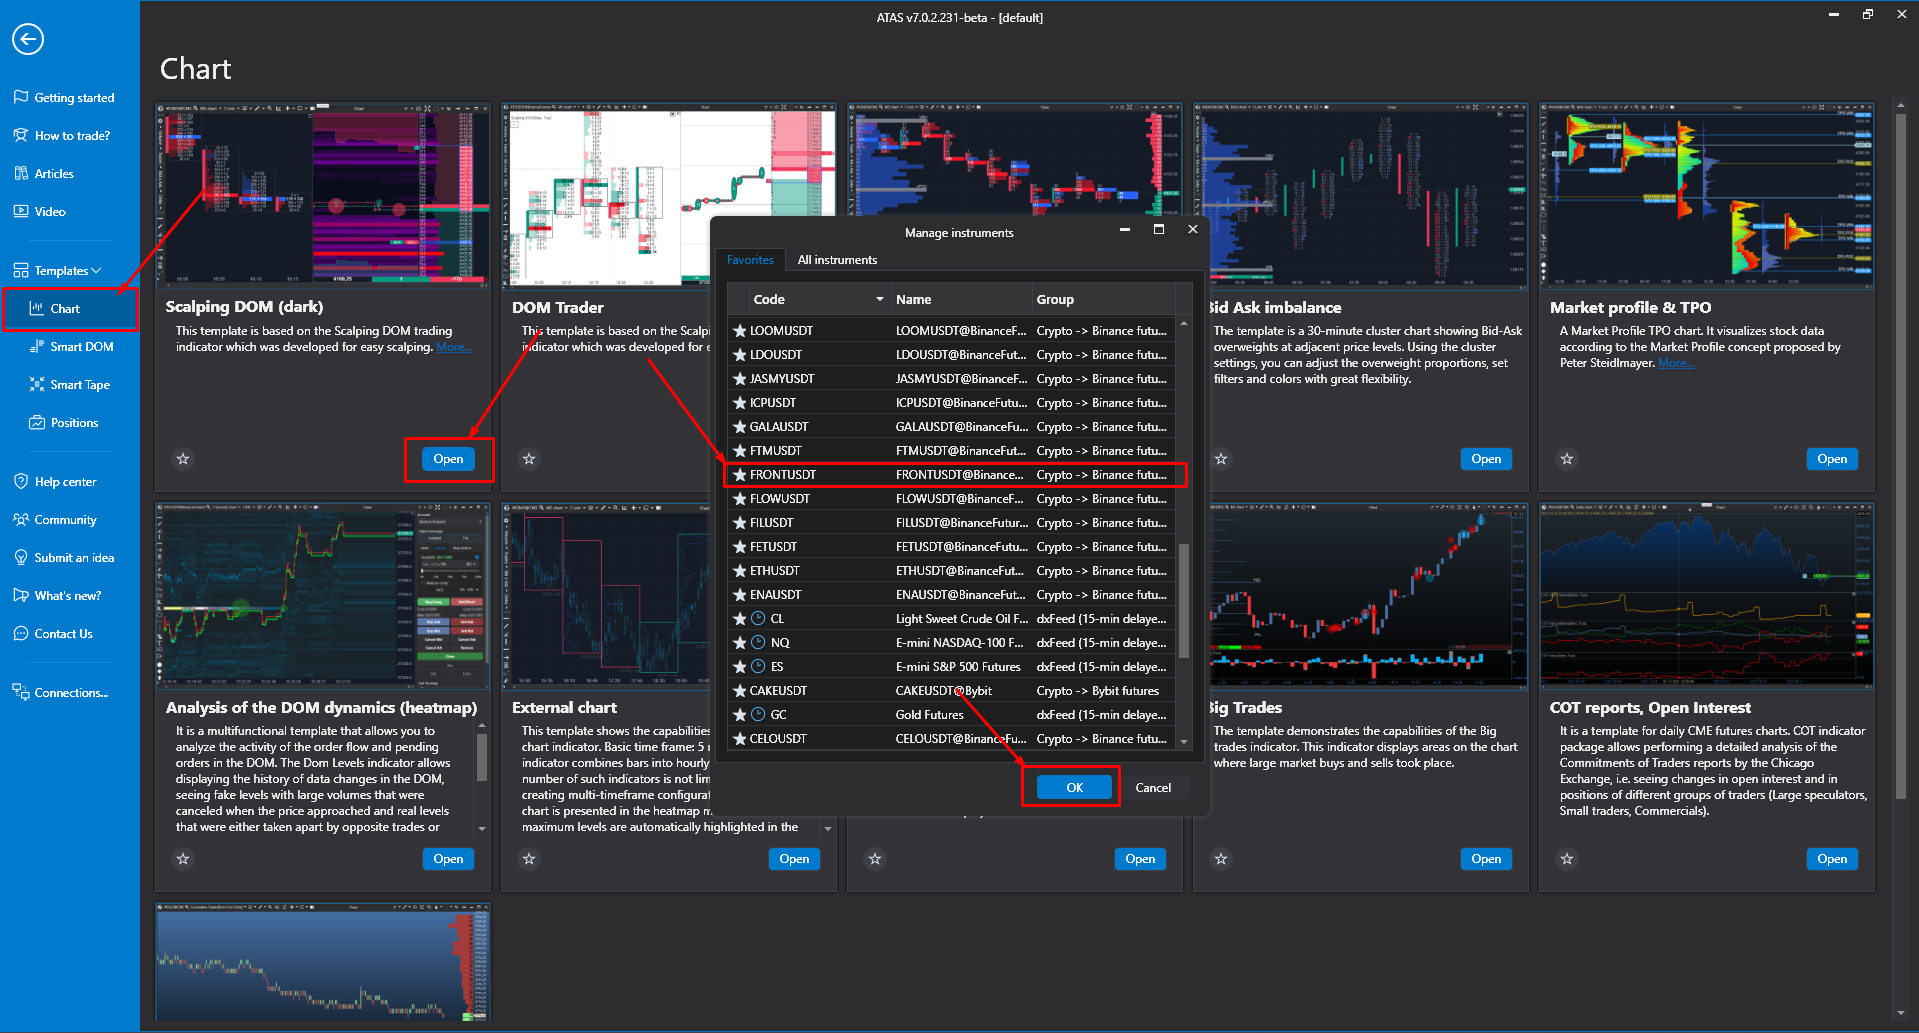
Order flow trading reveals the real mechanics behind price movement by showing the battle between buyers and sellers through volume and executed orders. ATAS (Advanced Trading Analytical Software) stands out as a professional desktop platform built specifically for this purpose.
It delivers unmatched transparency for futures, stocks, and crypto traders with advanced footprint charts, CVD, volume profiles, Smart DOM, and over 400 cluster variations.
Download the free version (14-day full trial): https://atas.net/atas-download/
Beginner Level: Getting Started with ATAS
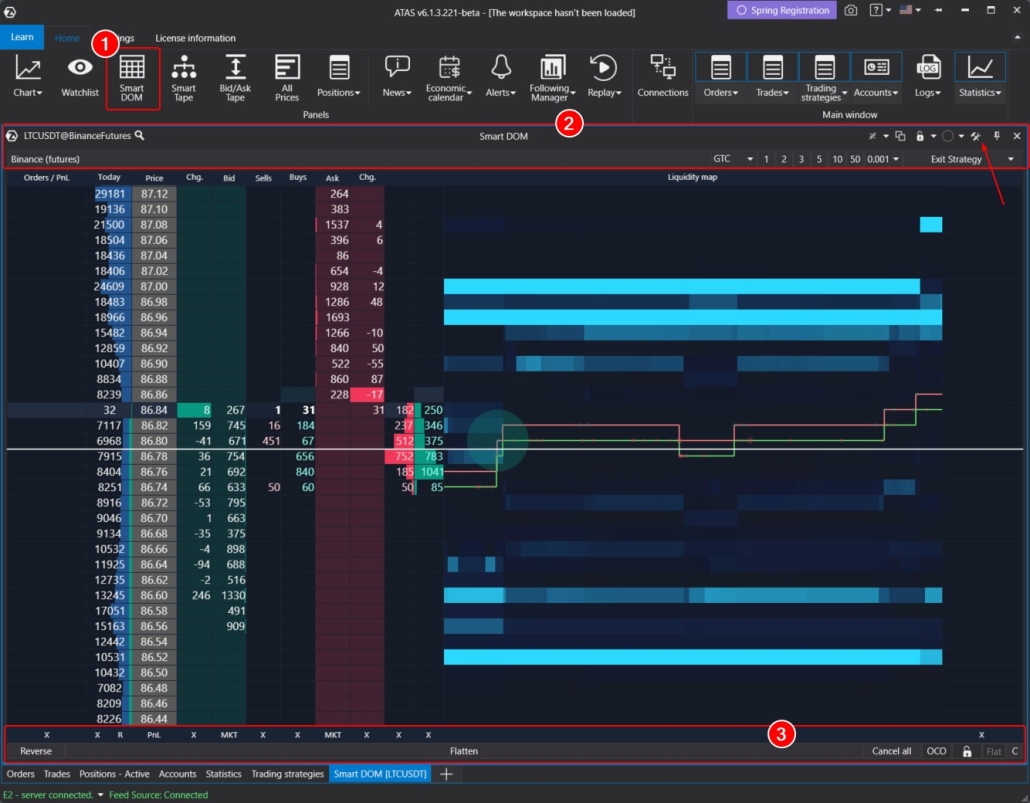
Step 1: Installation and First Chart
Download from the official site. Installation takes under 2 minutes. Connect your data feed (25+ exchanges including CME futures and Binance crypto).
Core Beginner Tools
- Smart DOM: Displays live bid/ask limit orders with color-coded aggression.
- Basic Volume & Delta Indicators: Green for market buys, red for market sells.
- Order Flow Indicator: Highlights large trades with circles (customizable threshold).
Pro Tip for Beginners
Start with the Market Replay simulator to practice without risk — replays historical data tick-by-tick.
Official replay guide: https://help.atas.net/en/support/solutions/articles/72000602247-replay-trading-simulator
Intermediate Level: Footprint Charts & Cluster Analysis
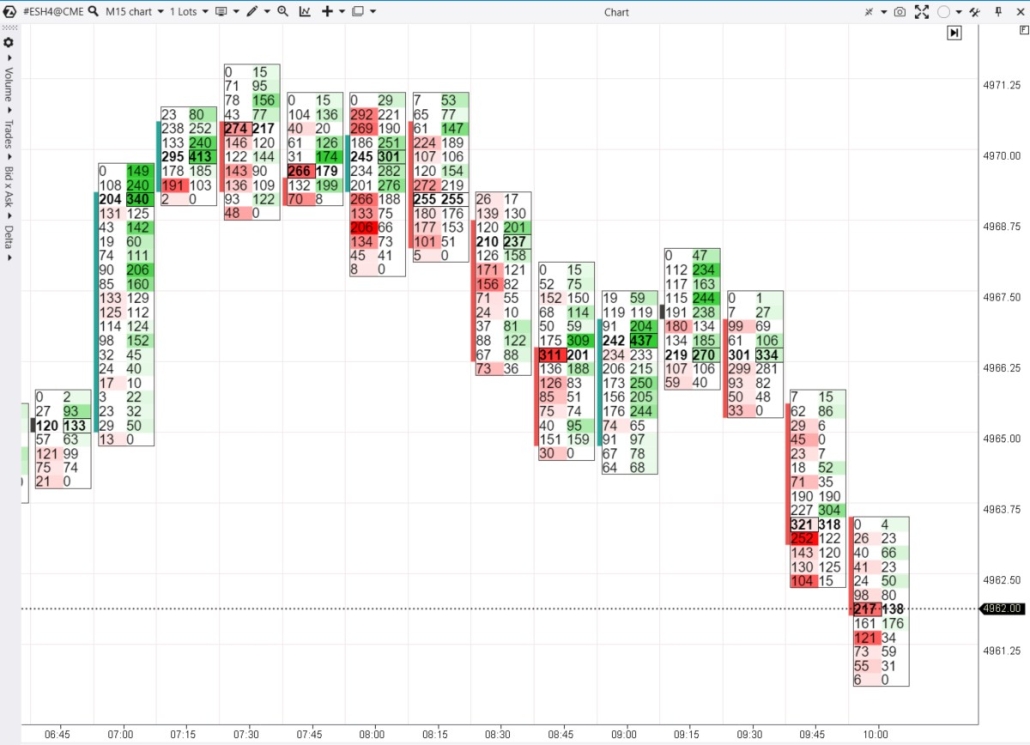
Footprint charts are the heart of order flow. They break every candle into a grid showing Bid x Ask, Delta, Volume, and Imbalance at each price level.
Key Footprint Modes in ATAS (over 400 variations)
- Bid x Ask (classic two-column)
- Delta Colored Volume
- Volume x Trade (aggressive vs. passive)
- Stacked Imbalance (buyer/seller dominance zones)
Common Patterns
- Absorption: Big volume but price stalls
- Imbalance stacks signaling acceleration
- Delta divergence inside bars
Official footprint tutorial: https://atas.net/blog/how-footprint-charts-work-footprint-modes-and-what-they-are-for/
Advanced Level: CVD Pro, Divergences & Volume Profile
CVD Pro
CVD tracks the running total of aggressive buying vs. selling. The Pro version lets you filter by trade size (>2,000 contracts) and run up to 5 lines simultaneously to separate retail vs. institutional activity.
CVD Divergences (High-Probability Setups)
- Bullish divergence: Price makes lower low while CVD makes higher low (hidden buying).
- Bearish divergence: Price makes higher high while CVD makes lower high (exhaustion).
Detailed CVD Pro article: https://atas.net/blog/cvd-pro/
Volume Profile Mastery
Fixed, session, and visible-range profiles highlight Value Area (70% volume), POC, and high-volume nodes that act as magnets or barriers.
Expert Settings & Strategy Optimization
Essential Settings
- Chart Periods: Use Order Flow bars (range or tick) for cleaner clusters.
- CVD Pro: Set min/max volume filters and line thickness.
- Clusters: Enable "Show Imbalance", "Delta Divergence Highlight".
- DOM Trader: Activate Liquidity Map and Exit Strategies.
Advanced Workflow
Footprint + CVD Multi + Volume Profile on one workspace. Enter on CVD divergence confirmed by imbalance stack at POC.
Market Replay + Statistics Module — test every setup historically and review your journal automatically.
Conclusion & Next Steps
ATAS transforms raw data into actionable edge by letting you see exactly who is driving price. Beginners start with DOM and footprint; advanced traders layer CVD Pro divergences, multi-timeframe profiles, and custom indicators.
Download ATAS now and start your 14-day full-feature trial: https://atas.net/atas-download/
Full order flow training: https://atas.net/blog/order-flow-in-trading-free-training-by-atas/
Further Reading & Resources