Footprint Charts Mastery
Spotting Trapped Longs & Shorts
From delta basics to advanced imbalance stacks — the complete professional guide to footprint charts for trapped trader detection.
Introduction: Unveiling Trapped Traders with Footprint Charts
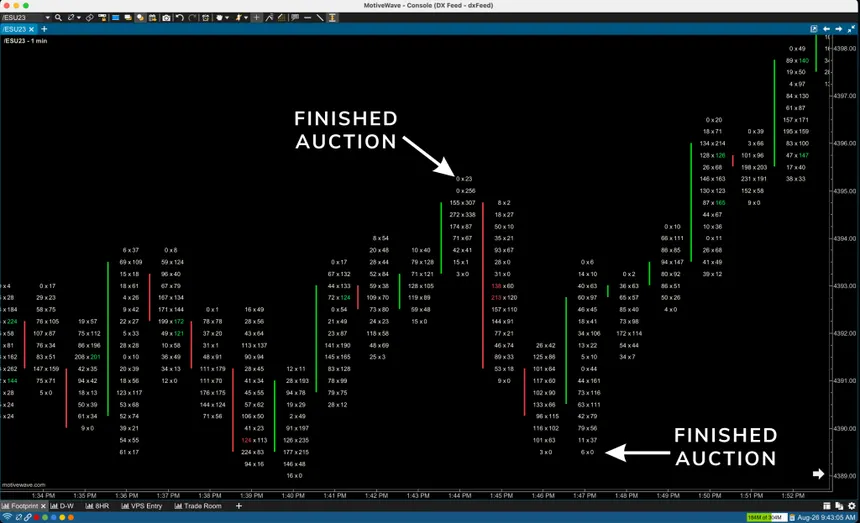
Footprint (cluster) charts provide granular visibility into order flow, breaking down each bar into bid/ask volume at price levels to reveal where traders get trapped. Trapped Shorts occur when aggressive selling is absorbed without downside, while Trapped Longs show buying absorbed without upside — signaling reversals.
Core Tools
- Bid x Ask Columns: Aggressive buys (ask) vs. sells (bid).
- Delta Coloring: Green for net buying, red for net selling.
- Imbalance Stacks: Asymmetries indicating dominance.
- Absorption Zones: High volume with minimal price change.
Beginner Level: Reading Footprint Basics and Patterns
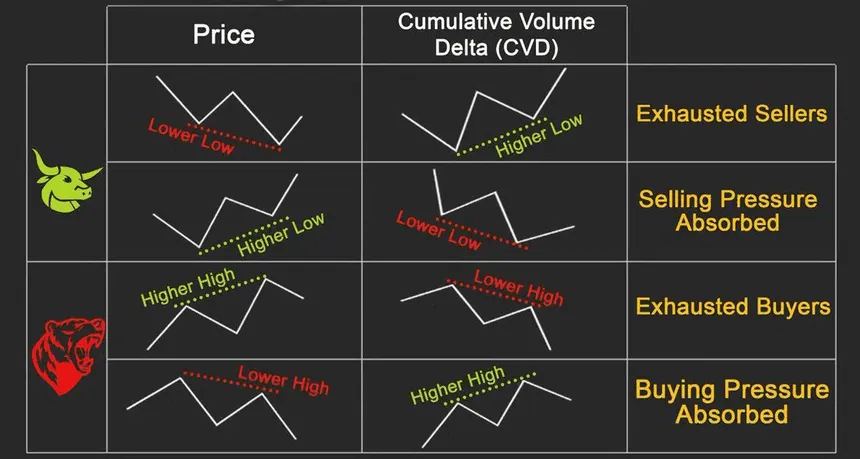
Footprint Essentials
- Green Cells: Buyer aggression (market buys).
- Red Cells: Seller aggression (market sells).
- Volume Clusters: High activity at specific prices.
Basic Patterns
- Absorption: Large volume bar with tight range — institutions defending.
- Delta Flips: Sign change within bar — potential exhaustion.
Pro Tip for Beginners
Start with delta-colored mode on ATAS or Quantower to visualize flow intuitively.
Intermediate Level: Identifying Trapped Shorts and Trapped Longs
Trapped Shorts
Heavy red delta (selling) but price holds — buyers absorbing, leading to upside reversal.
Trapped Longs
Heavy green delta (buying) but price stalls — sellers absorbing, signaling downside.
High-Probability Reversal
Stacked imbalances + delta divergence = trapped positions about to unwind.
Intermediate Strategies
- Scan for absorption at support/resistance.
- Confirm with volume profile for added strength.
Advanced Level: Multi-Filter Footprints and Confluence
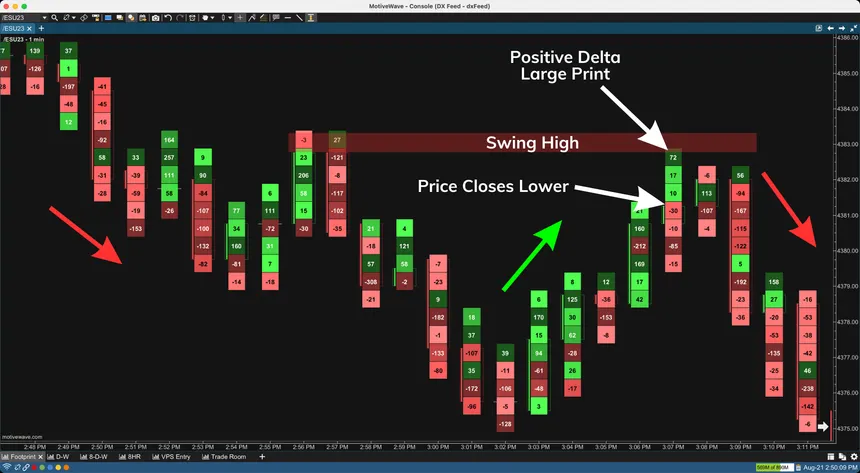
Advanced Features
- Unfinished Auctions: Open edges indicating potential continuation.
- Trade Size Filters: Isolate large orders (>100 contracts) for institutional signals.
Confluence Strategies
- Footprint absorption + CVD divergence + VWAP reclaim = elite entry.
- Stacked Imbalances: 3+ levels of asymmetry for momentum confirmation.
Expert Workflow: Settings, Optimization, and Risk Management
Expert Settings in ATAS/Quantower
- Enable imbalance 300%, delta coloring, unfinished auction detection.
- Rows: Bid/Ask, Delta, Volume, Trades.
Pro Workflow
- Pre-Market: Identify prior absorption zones.
- Intraday: Trade delta flips with tight stops.
- Post-Market: Review for patterns.
Risk Management
- Stops: Beyond absorption range (0.5-1% risk).
- Sizing: Scale based on confluence strength.
Optimization
- Backtest on replay mode; combine with TPO for value alignment.
Conclusion & Next Steps
Footprint charts empower traders to spot trapped positions and institutional intent, transforming order flow data into actionable edges.
Key Resources
- YouTube Order Flow Tutorial: https://www.youtube.com/watch?v=ODPNk_Cuzyc
- ATAS Footprint Modes: https://atas.net/blog/how-footprint-charts-work-footprint-modes-and-what-they-are-for/
Further Reading & Resources