Mastering Order Flow
CVD, Delta, Absorption & Divergences
From foundational Delta and CVD to advanced divergences and absorption — the complete professional guide to order flow mastery.
Understanding Order Flow: The Foundation of Market Dynamics
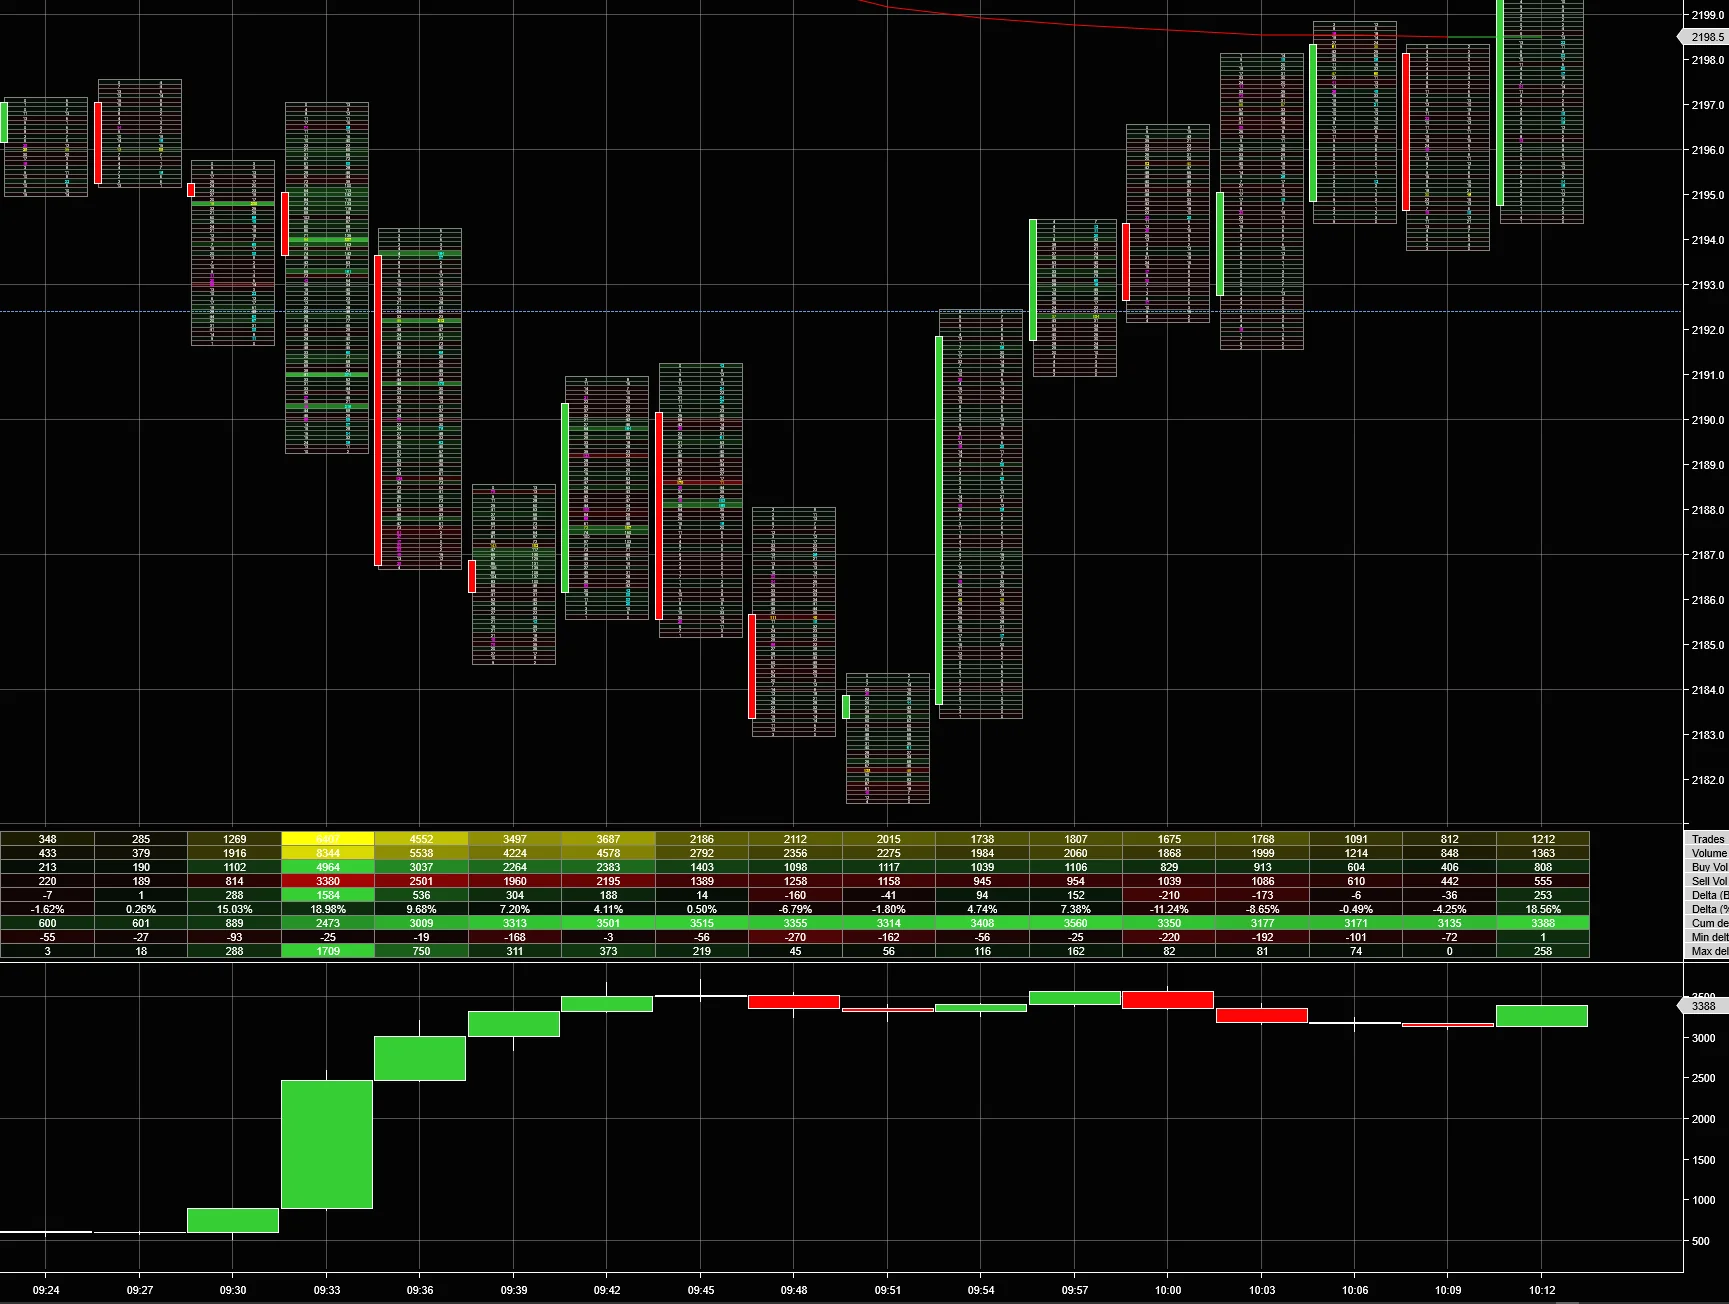
Order flow analysis uncovers the genuine battle between buyers and sellers by examining executed volume at each price level. Unlike traditional price action, it reveals aggressive intent through CVD, Delta, Absorption, and divergences.
Core Benefits
- Detects hidden accumulation and distribution before price moves.
- Identifies exhaustion and high-probability reversal points.
- Provides confluence with tools like Volume Profile and TPO.
Beginner: Core Concepts — Delta, CVD, and Absorption
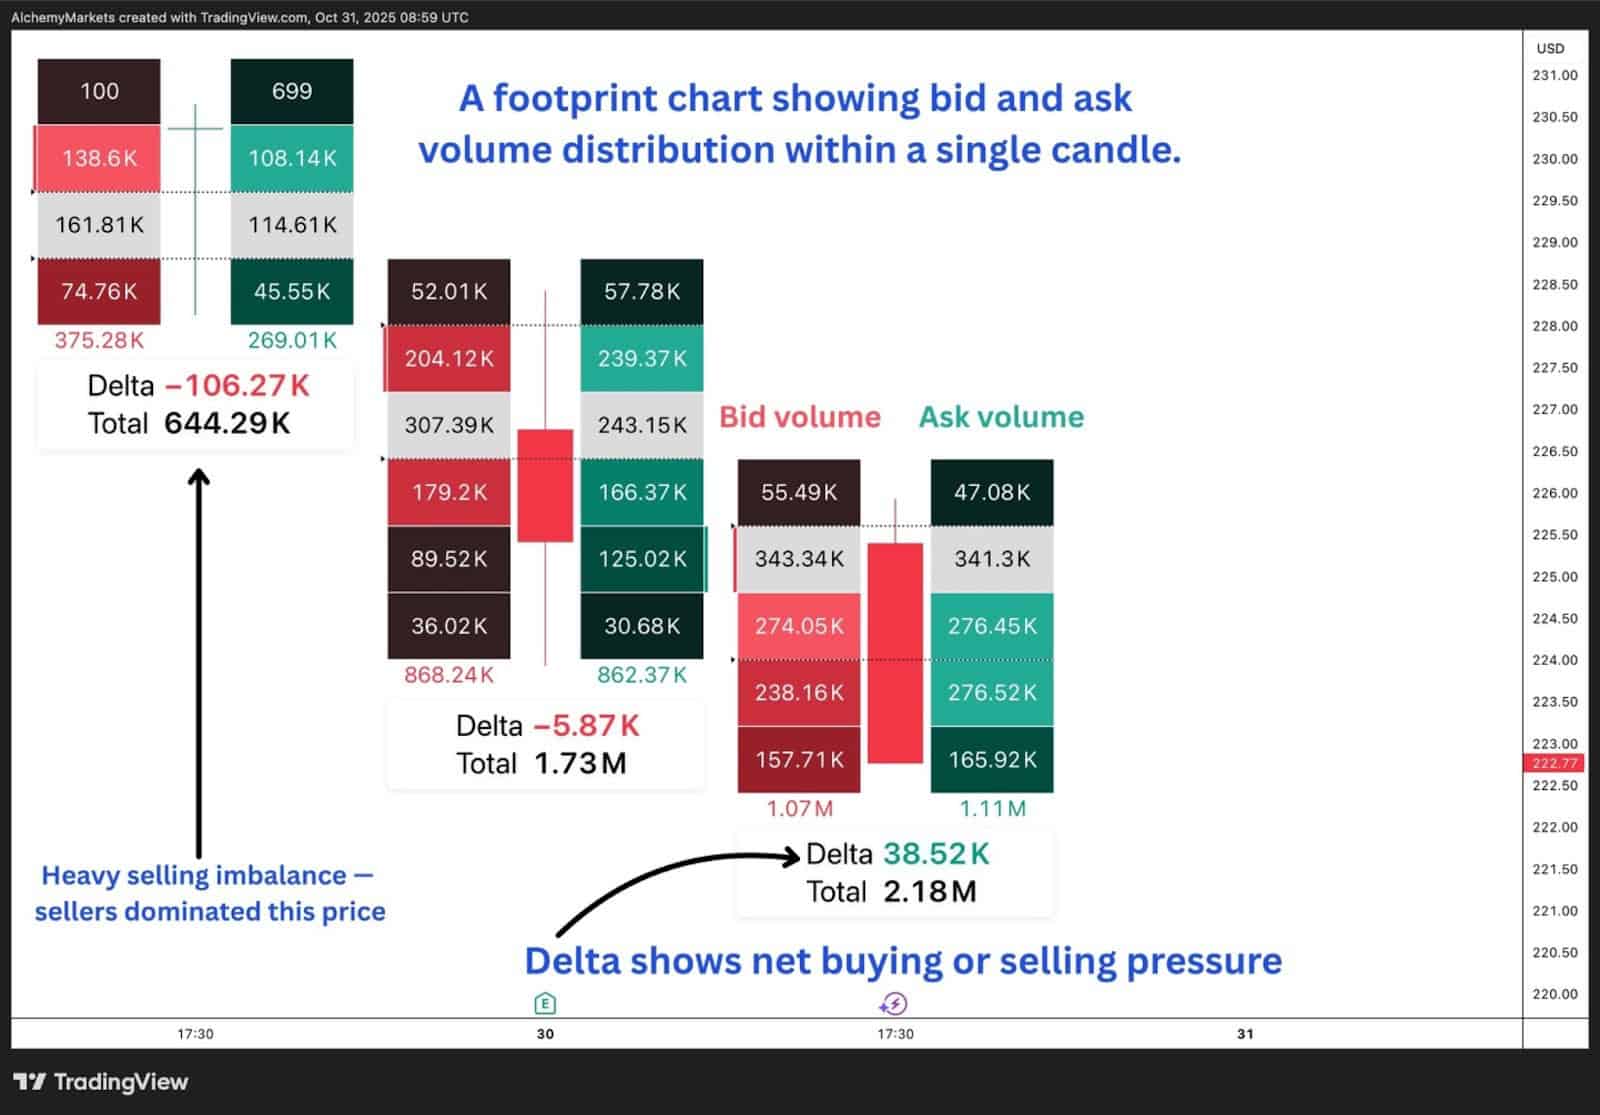
Delta
Delta measures the difference between buy and sell volume. Positive delta = buyer aggression; negative delta = seller dominance.
CVD (Cumulative Volume Delta)
CVD accumulates Delta over time. Rising CVD = sustained buying; falling CVD = selling dominance.
Absorption
Absorption occurs when large volume trades at a level with minimal price movement — institutions absorbing aggressive orders.
Basic CVD Interpretation
- Steadily rising CVD during uptrends: Strong buyer control.
- CVD flat while price rises: Passive buying, less conviction.
- CVD divergence from price: Potential reversal signal ahead.
Intermediate: Footprint Charts & Absorption Patterns
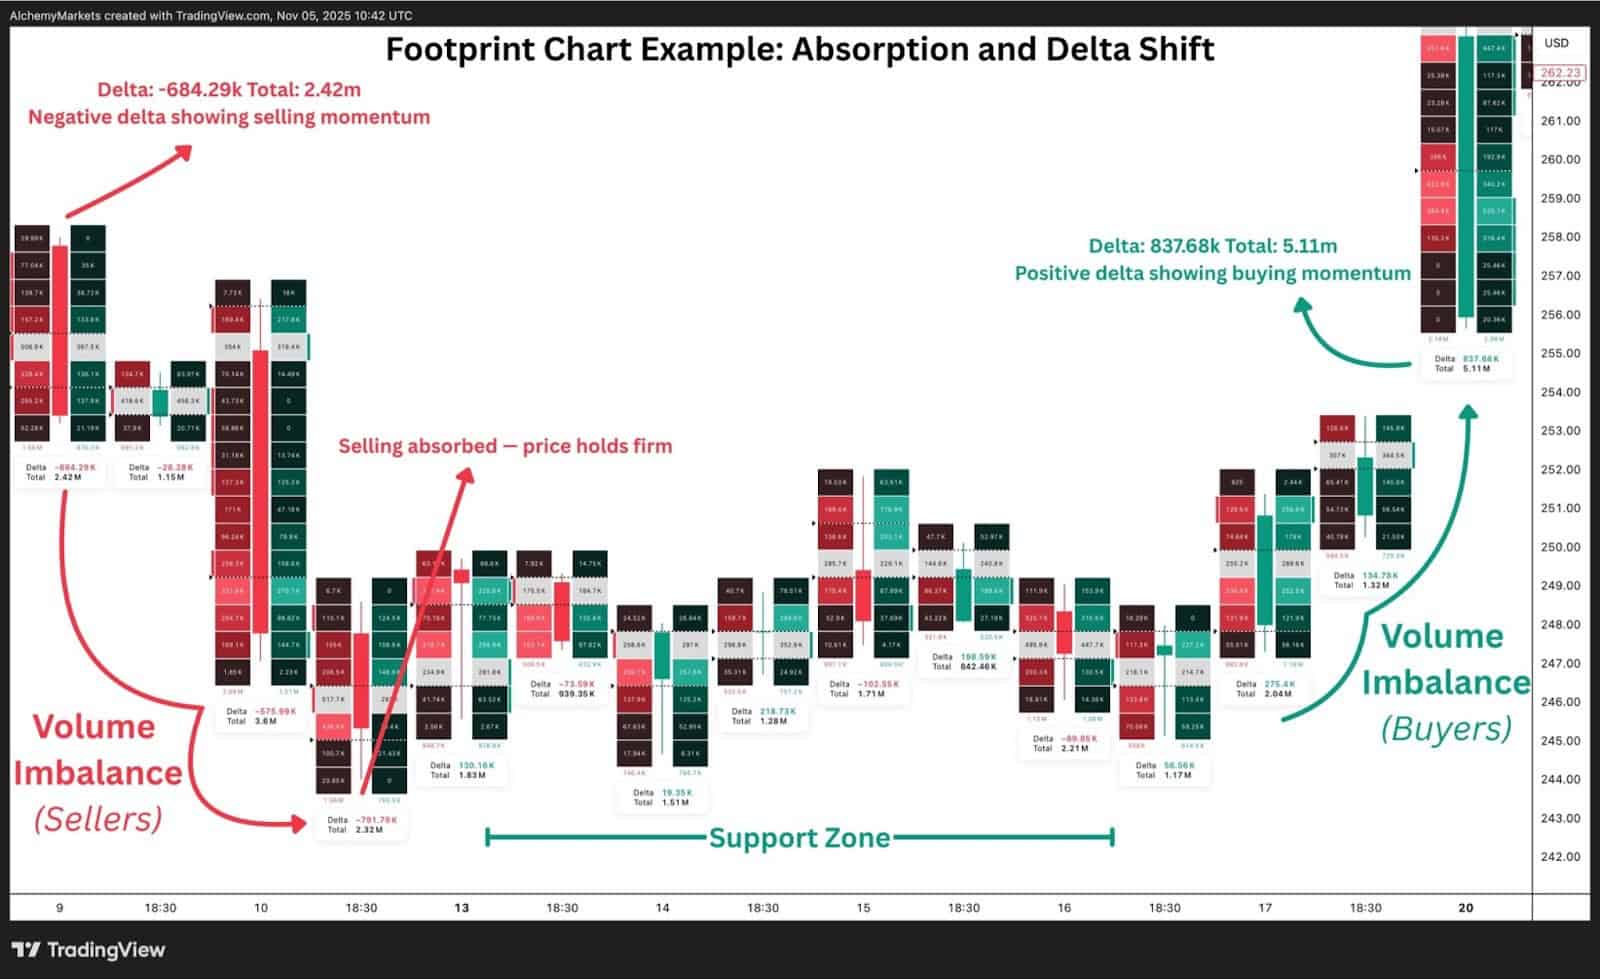
Footprint Charts
Footprint charts break each candle into bid/ask volume at price levels, revealing delta flips, imbalances, and absorption zones.
Identifying Absorption
- High-volume node with small price range: Institutions absorbing aggression.
- Delta sign flips within a single bar: Trapped traders or exhaustion signal.
- Price stalls at a level repeatedly: Institutional defense confirmed.
Pro Tip: Use trade size filters to isolate large orders (>200 contracts) at key support/resistance.
Advanced: Divergences & Multi-Filter Strategies
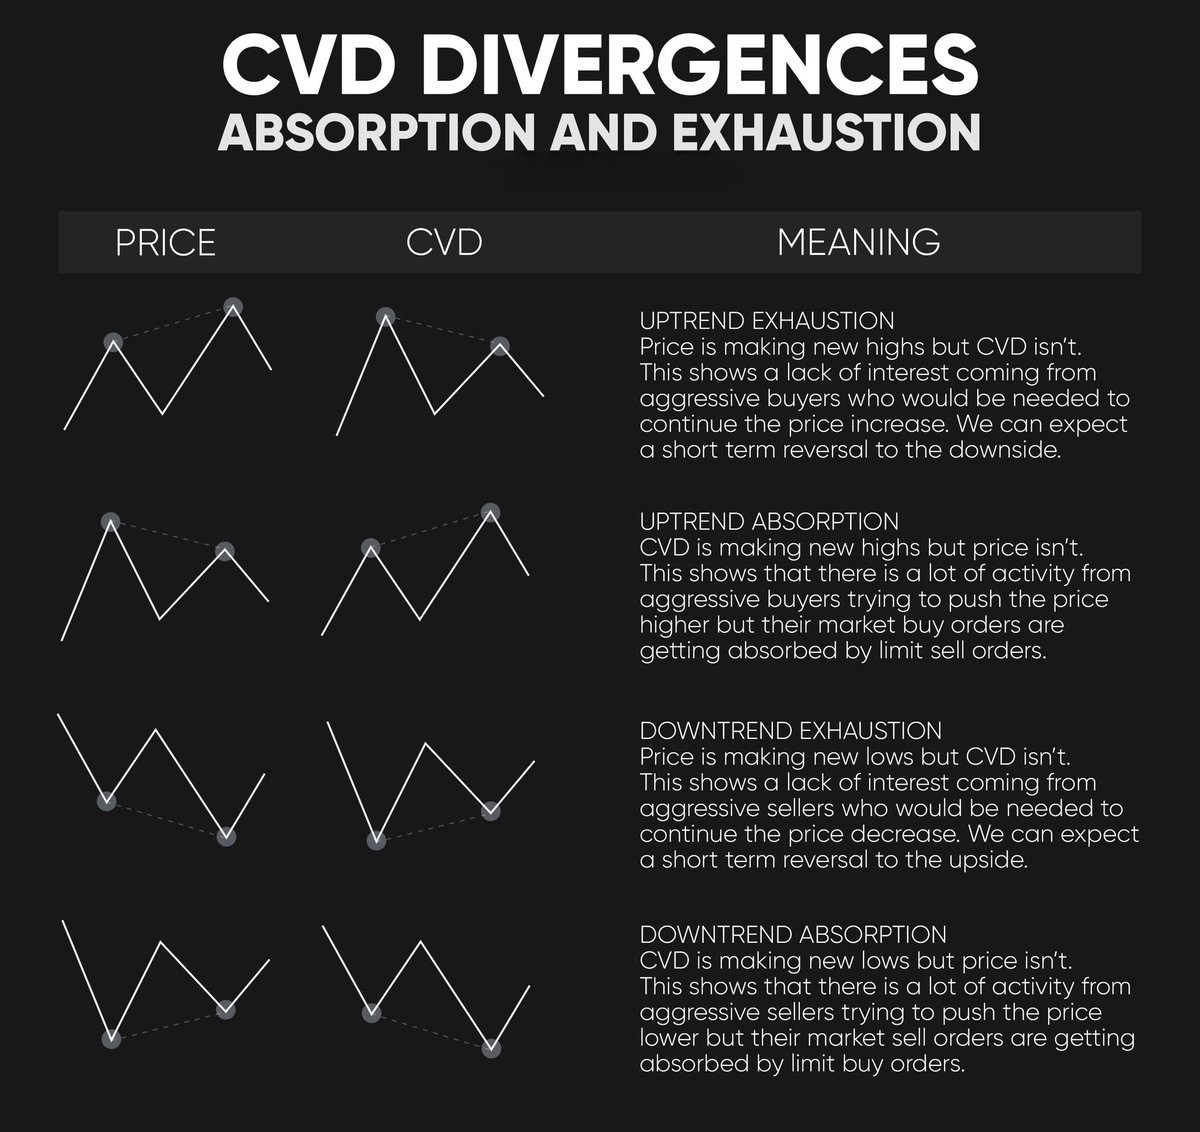
CVD Divergences
- Bullish Divergence: Price makes lower lows while CVD makes higher lows — hidden buying accumulation.
- Bearish Divergence: Price makes higher highs while CVD makes lower highs — distribution.
Advanced Confirmation
Stacked imbalances + negative delta absorption at key support = high-probability reversal setup.
Multi-Filter Strategies
- Combine CVD with footprint imbalances and volume profile nodes.
- Filter CVD by trade size (>500 contracts) to isolate institutional flow.
- Align divergences across multiple timeframes for highest conviction entries.
Expert Settings & Practical Workflow
Expert Settings in ATAS
- CVD: Enable multi-line display. Set minimum size filters and enable divergence highlights.
- Footprint: Use delta-colored mode, enable stacked imbalance display, overlay Value Area lines.
Practical Workflow
- Scan CVD divergences on 1H or 4H chart to establish directional bias.
- Drop to 5-minute chart for footprint absorption confirmation at key levels.
- Enter on the 3-candle pattern with order flow alignment.
- Backtest all setups using the platform's historical market replay.
Common Pitfalls
- Ignoring broader context: Always verify with overall market structure.
- Over-filtering: Start with broad thresholds, then refine.
- Chasing entries: Wait for the full pattern to complete.
Conclusion & Next Steps
Mastering CVD, Delta, Absorption, and divergences unlocks the true mechanics behind price movement.
Key Resources
- ATAS official order flow training: https://atas.net/blog/order-flow-in-trading-free-training-by-atas/
- CVD deep dive by LuxAlgo: https://www.luxalgo.com/blog/cumulative-volume-delta-explained/
- Footprint patterns guide: https://atas.net/blog/how-footprint-charts-work-footprint-modes-and-what-they-are-for/