Mastering Aggregated Order Flow
with Market Monkey Terminal
From aggregated footprint charts to bucketed CVD and liquidity heatmaps - this is the mobile-friendly professional guide to Market Monkey Terminal (MMT).
Why Professional Traders Choose Market Monkey Terminal (MMT)
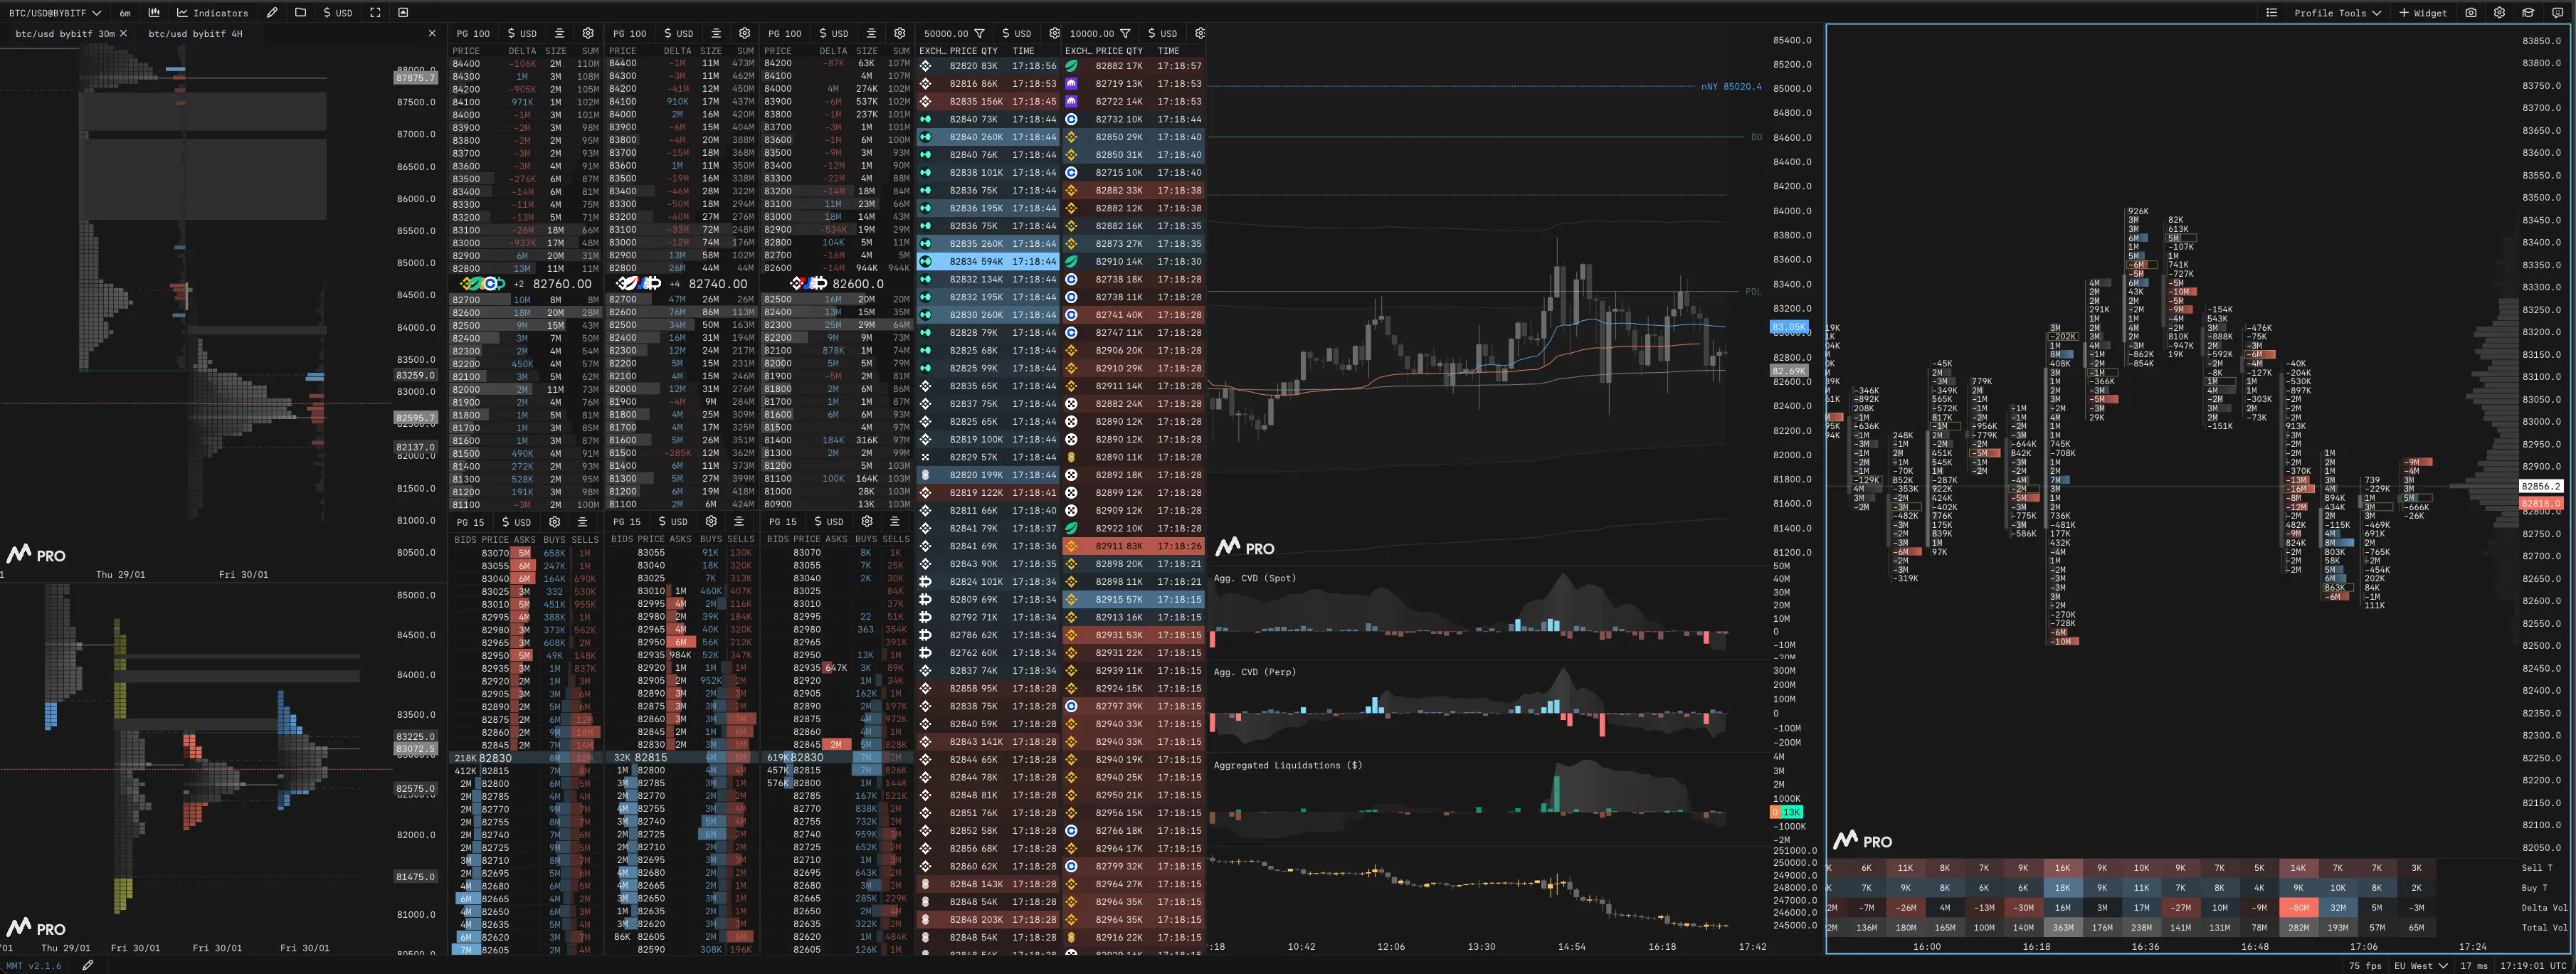
Market Monkey Terminal (MMT) is a browser-based order flow platform built for traders who want one clean view of crypto execution data across many exchanges.
It combines aggregated footprint charts, bucketed CVD, liquidity heatmaps, naked POCs, and responsive layout tools without forcing traders to juggle multiple apps.
Official website: https://mmt.gg/
Beginner Level: Getting Started with MMT
Quick Start
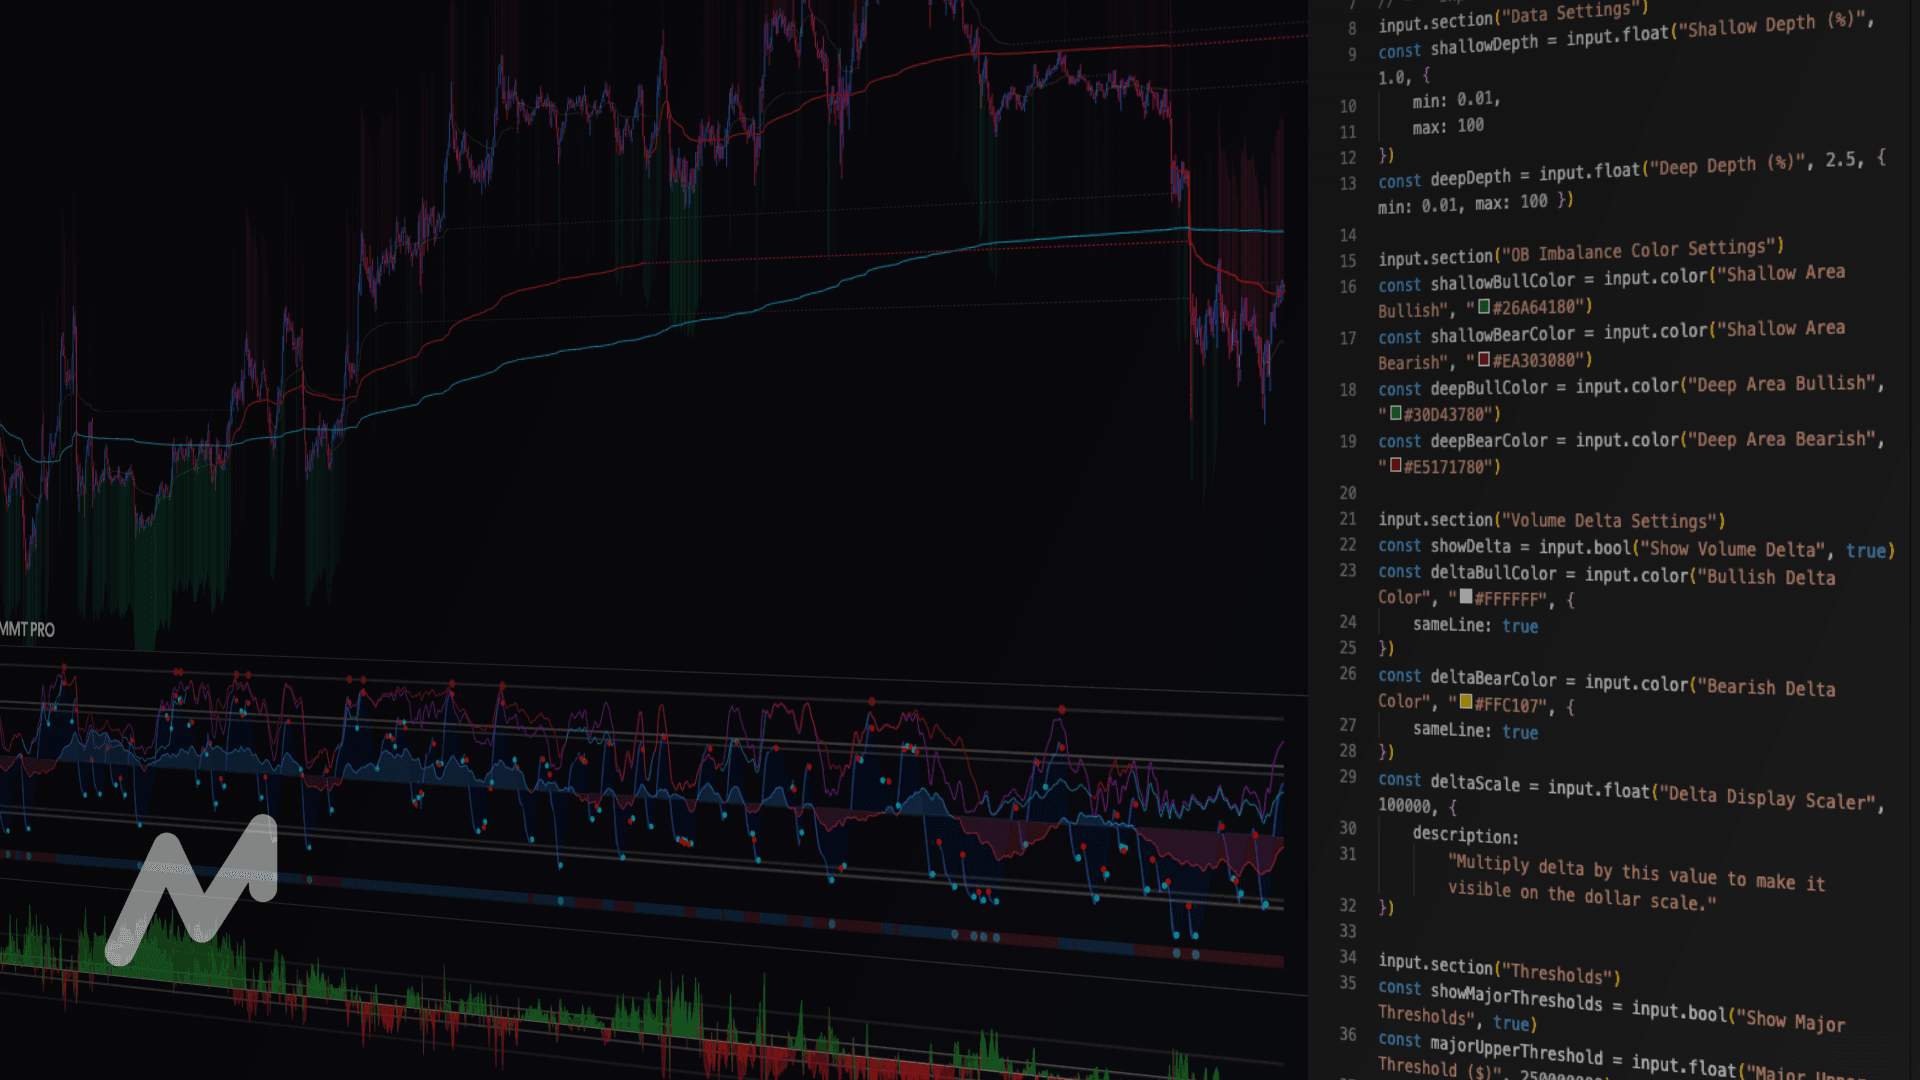
Register at mmt.gg, choose your symbols, and open the platform directly in the browser. The free tier makes it easy to explore the workspace before committing to a deeper setup.
Starter Workspace
- Begin with a workstation layout that shows open interest, CVD, and delta on the main chart.
- Add a synced footprint chart, volume profile, and community indicators such as net positioning.
- Keep liquidation data visible for the venues you actively trade.
Session and TPO Views
- Build a 30-minute session chart to mark Asia, London, New York, and key volatility windows.
- Save separate TPO layouts for session structure and daily structure so you can switch quickly.
Terminal Routine
- Use the terminal layout first thing in the morning for daily bias, structure, and key highs or lows.
- Add round-number charts and multi-asset panels to monitor front-running around major levels.
Practice Flow
Use replay, saved templates, and fast layout switching so your routine feels repeatable instead of improvised.
Intermediate Level: Footprint Charts and Liquidity Analysis
Why the Footprint Matters
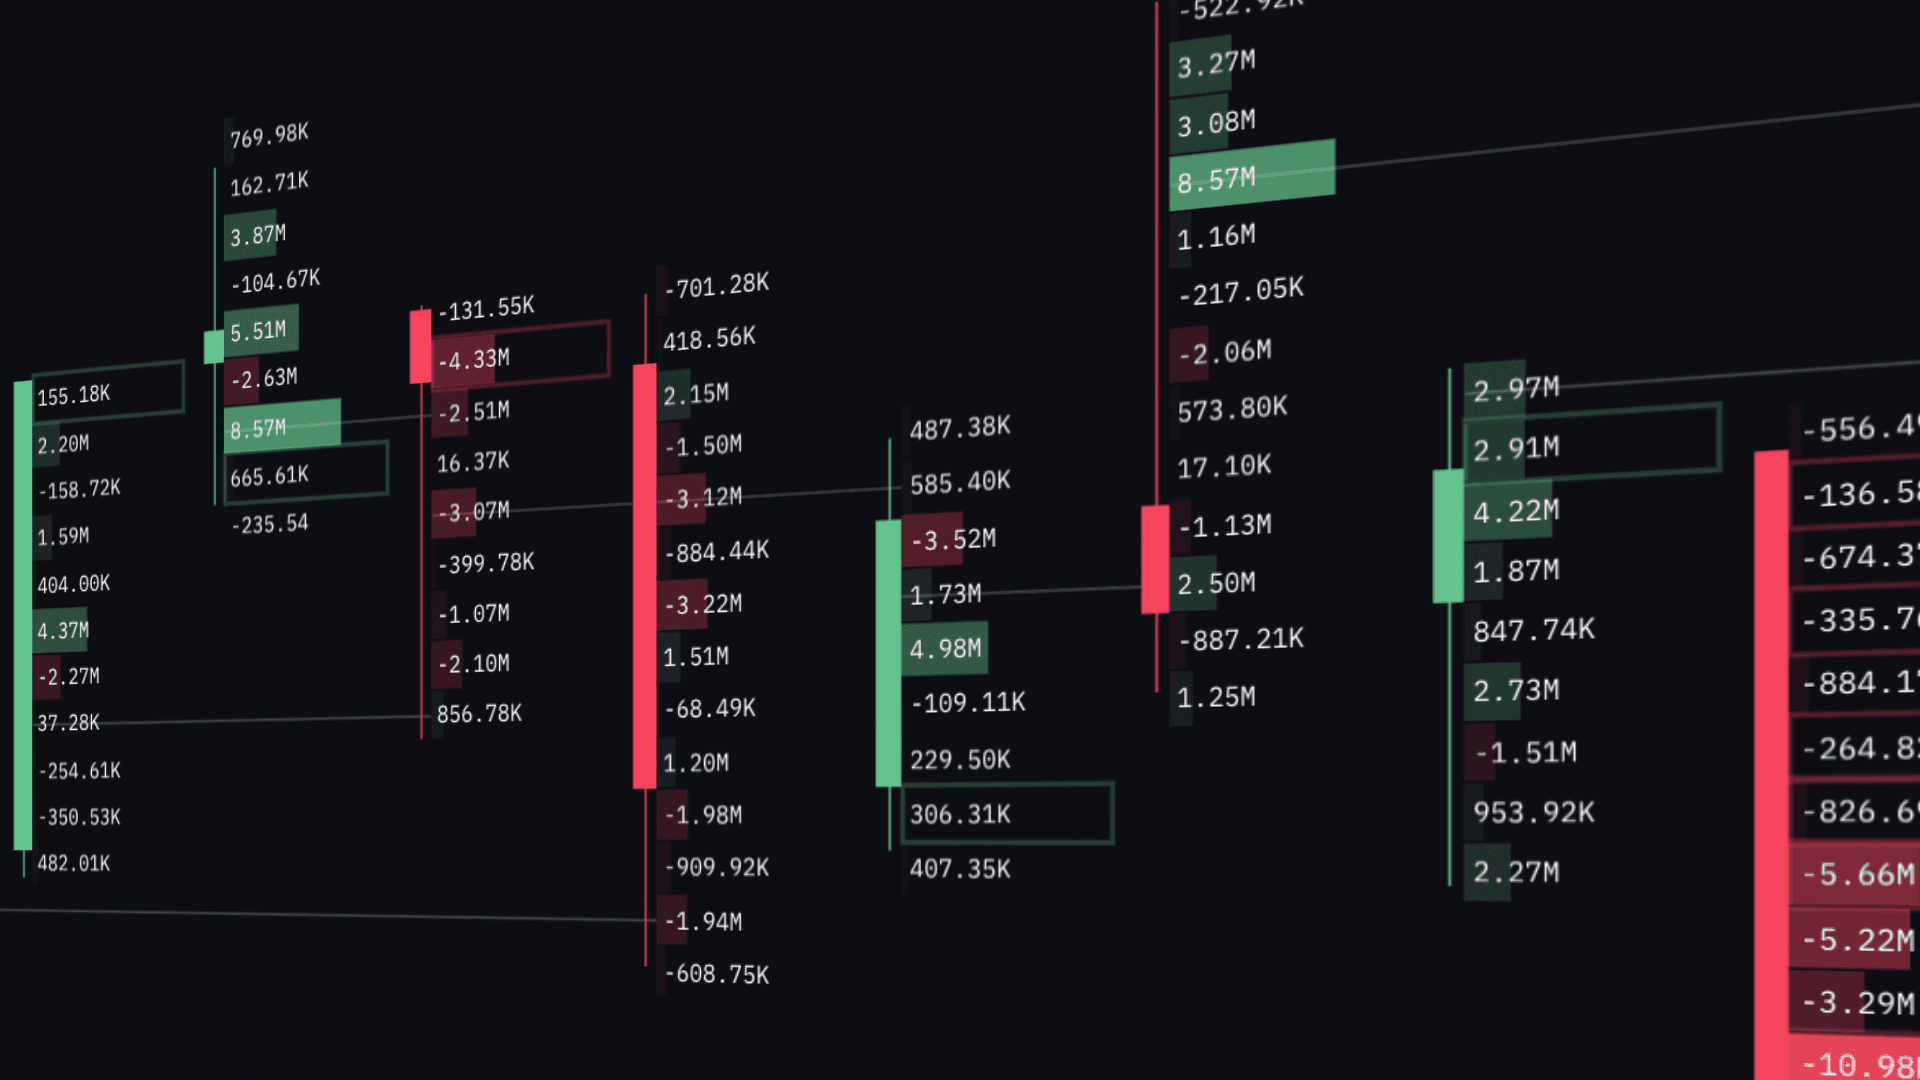
MMT builds its footprint from raw tick data, which helps traders inspect participation, tempo, and response around key prices.
Key Features
- Configurable volume and delta grading.
- Imbalance markers for aggressive buying or selling.
- Naked POCs for untouched high-interest levels.
- Trade speed counters for measuring urgency.
Suggested Setup
Tune the bin size, enable imbalance highlights, and keep the related profile visible so the footprint and structure context stay connected on smaller screens and full desktop layouts.
Stacked Imbalance Guide
Definition
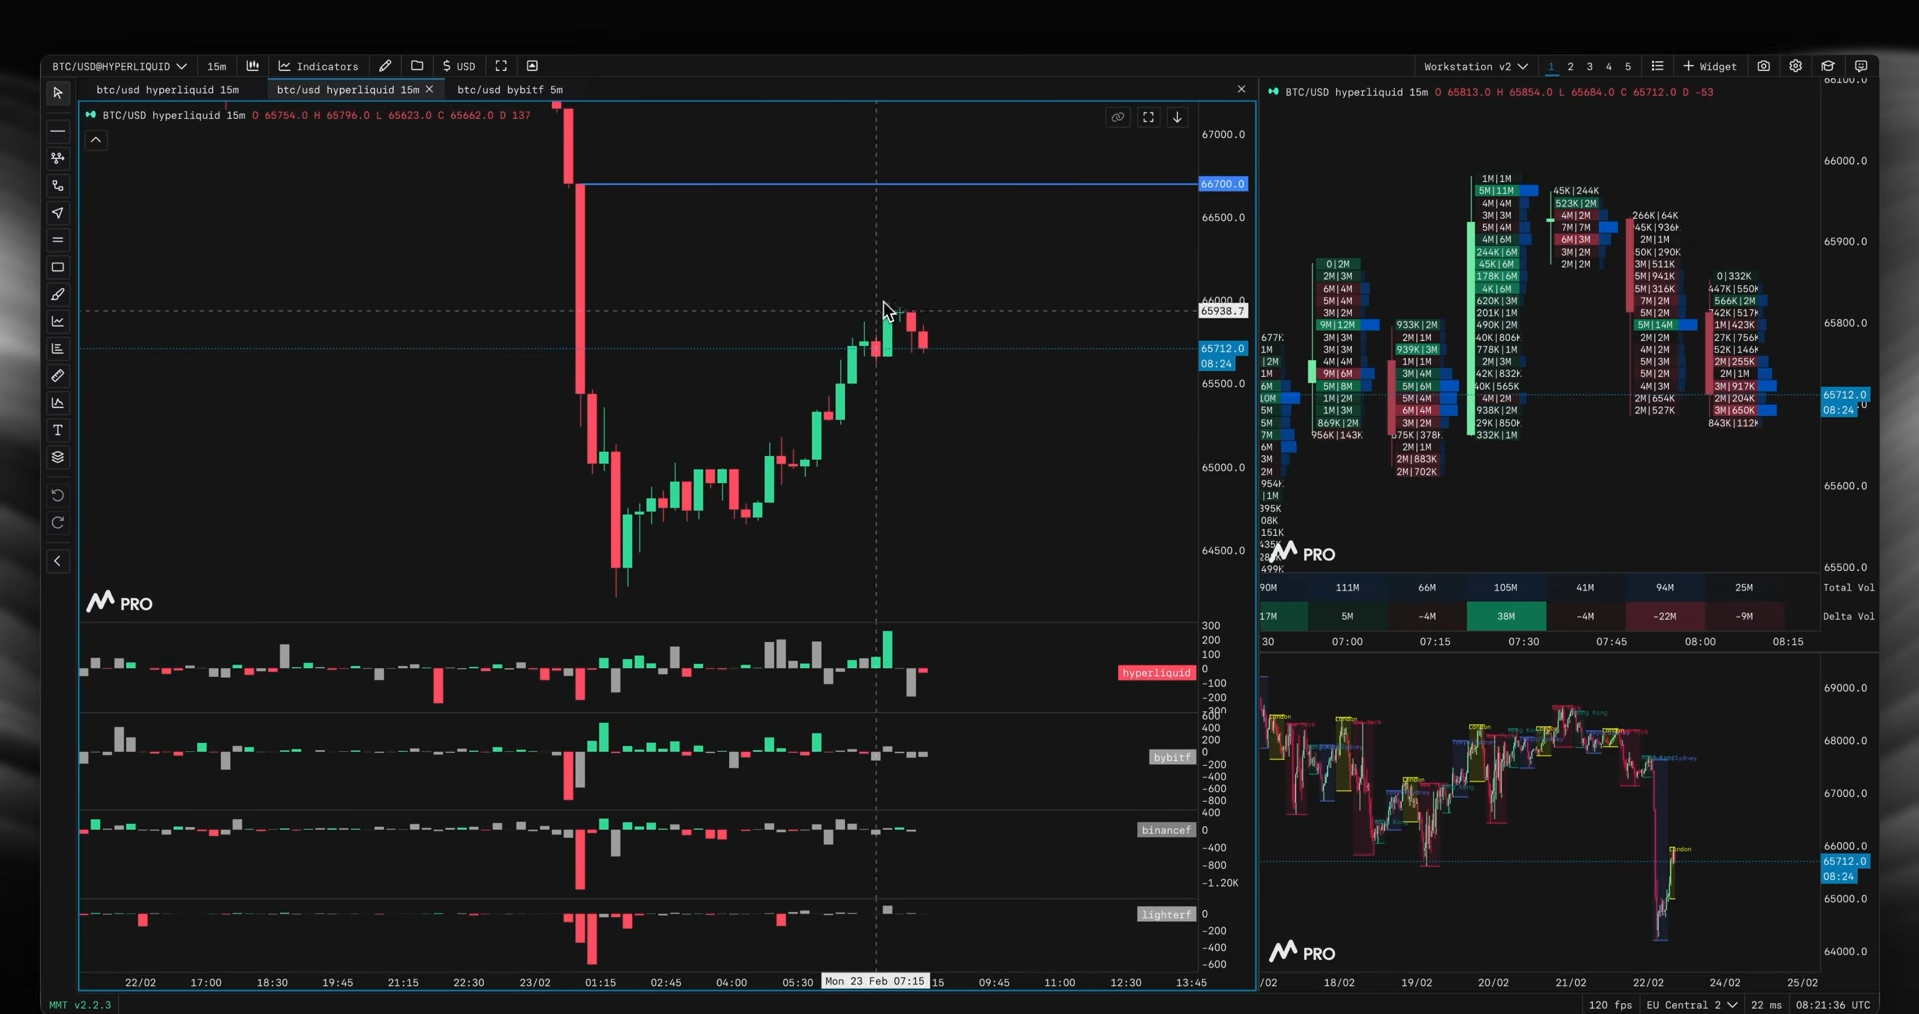
Stacked imbalances appear when several buy or sell imbalances line up across consecutive price levels. Traders often treat them as support, resistance, or breakout reference zones.
How They Form
- Compare diagonal bid and ask volume at nearby prices.
- Use a threshold such as 300% to 400% to define imbalance strength.
- Look for three or more aligned levels to create a meaningful stack.
What Makes a Stack Useful
- Higher real volume usually matters more than thin prints.
- Open interest can help separate fresh positioning from simple closing activity.
- Minimum-volume filters remove low-quality noise.
Trading Use Cases
Return moves into a strong green stack can act as support, while red stacks often behave like resistance. The best signals usually come when footprint context, open interest, and broader structure agree.
Advanced Level: Aggregated CVD Divergences and Heatmaps
Aggregated CVD
MMT is especially useful when you want one cumulative view of aggressive flow across multiple crypto venues instead of reading each exchange in isolation.
High-Probability Divergences
- Bullish divergence: price makes a lower low while aggregated CVD forms a higher low.
- Bearish divergence: price makes a higher high while aggregated CVD forms a lower high.
Heatmap Confirmation
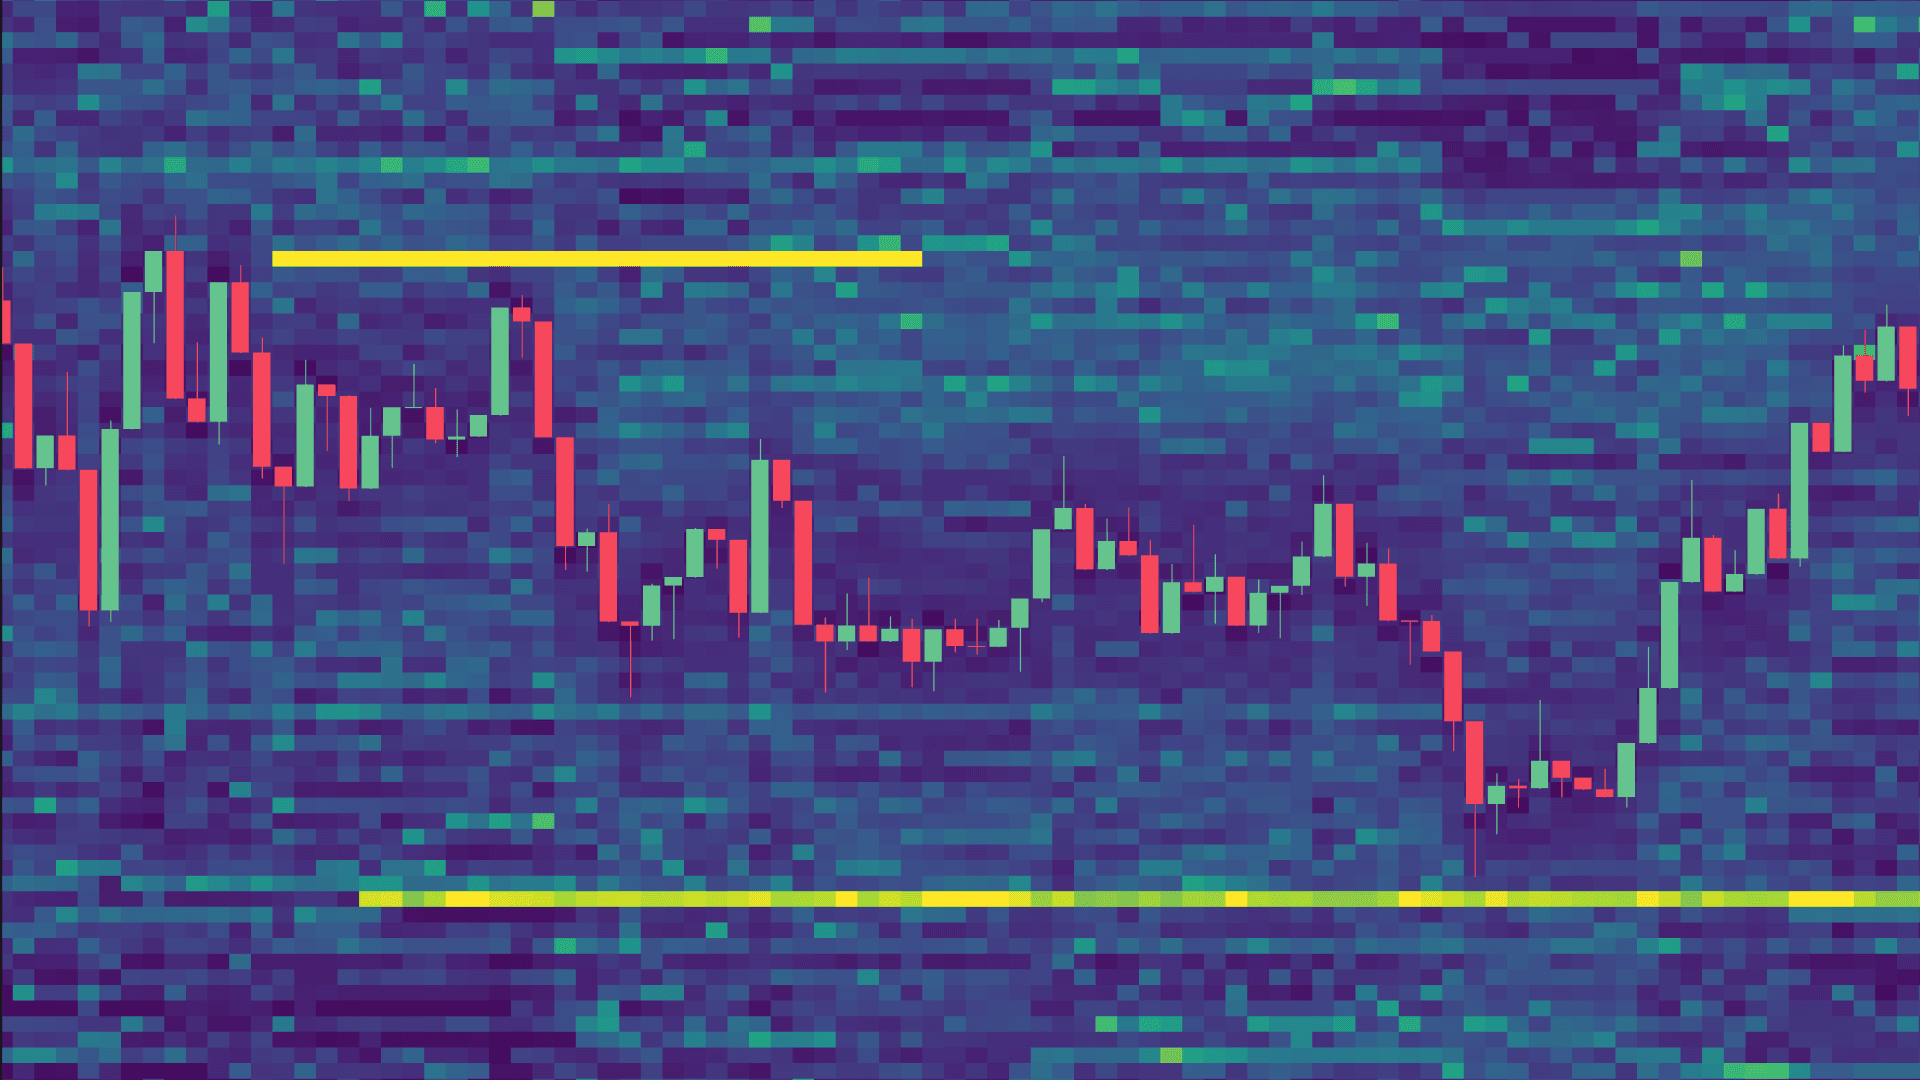
Pair CVD with the liquidity heatmap to spot absorption, hidden defense, and breakout conditions. When heatmap pressure and CVD disagreement line up, the trade idea becomes much easier to validate.
Expert Settings and Multi-Exchange Workflow
Professional Workflow
- Run more than one CVD bucket size to separate retail noise from larger participation.
- Combine footprint, heatmap, and aggregated CVD on the same workspace.
- Save custom templates for BTC, ETH, and the altcoins you monitor most.
Execution Notes
Track naked POCs, imbalance zones, and session structure across exchanges so you can compare where liquidity is actually respected. The goal is not more widgets - it is faster alignment between context and execution.
Conclusion and Next Steps
MMT gives crypto traders a practical way to study order flow without jumping between fragmented exchange interfaces. Start simple, build repeatable layouts, and then layer on the advanced tools that genuinely improve your read.
Ready to explore the platform? Visit https://mmt.gg/ and build a workflow that matches your market and timeframe.
Official Access