Advanced Fibonacci
Trading Techniques
From retracements to time extensions — a comprehensive professional guide to Fibonacci tools for market precision.
Introduction to Fibonacci Trading: Precision in Market Analysis

Fibonacci tools, rooted in the mathematical sequence and golden ratio, are indispensable for traders seeking high-probability support, resistance, and timing levels. Ratios such as 0.618, 0.786, 0.88, 0.382, 0.5, and extensions like 1.618 appear naturally in price action.
This guide explores retracements, custom channels, negative levels, expansions, and time extensions. Examples focus on Bitcoin (BTC), but principles apply across assets. Combining these techniques enhances decision-making and aligns with institutional flows.
Drawing Fibonacci Retracements: Fundamentals and Best Practices
Fibonacci retracements measure potential pullbacks in trends, plotting key ratios to forecast reversal points.
Drawing Guidelines
- Uptrend (Resistance): Draw from left-side swing low to right-side swing high.
- Downtrend (Support): Draw from left-side swing high to right-side swing low.
This left-to-right orientation ensures levels align with trend direction. On TradingView, customize levels to include 0.236, 0.382, 0.5, 0.618, 0.786, 0.886, and 1.0.
Common Applications
- Identify bounce zones during corrections.
- Confirm with volume spikes or candlestick patterns for entry.
Pro Tip: Always use multiple swings for confluence — e.g., weekly and daily Fibs — to strengthen signals.
Official TradingView guide: https://www.tradingview.com/support/solutions/43000502338/
The 0.382 Level and Trend Strength Assessment
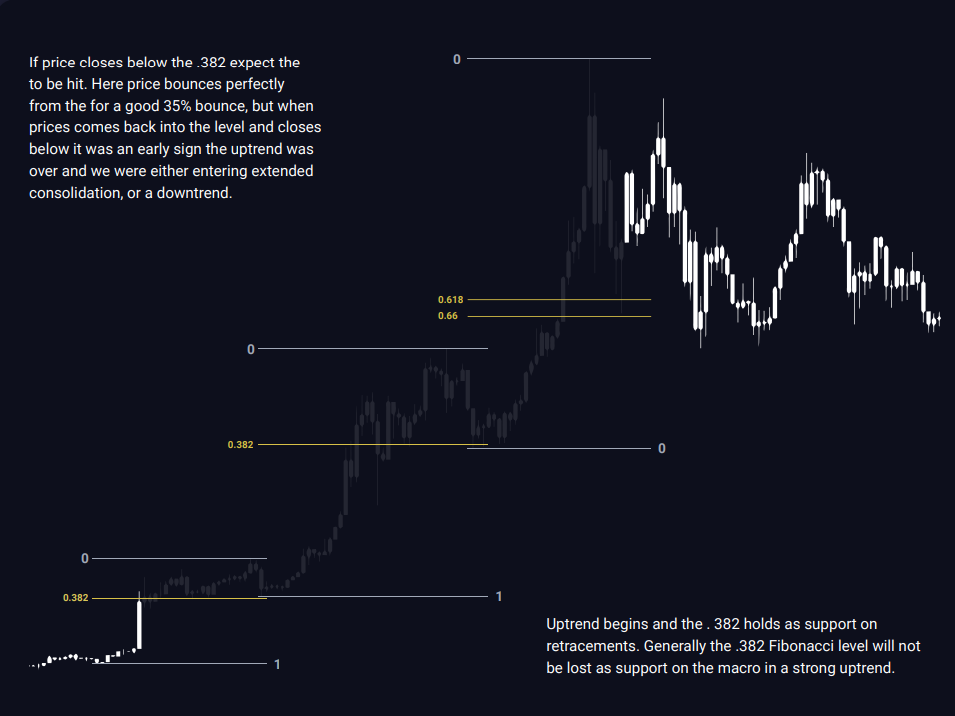
In robust uptrends, the 0.382 retracement often serves as primary support, rarely breached on macro scales. A close below signals potential deeper pullbacks to 0.618.
Trend Strength Indicators
- Hold at 0.382: Confirms strong momentum; expect continuation.
- Loss of 0.382: Targets 0.618; may indicate consolidation.
If 0.382 fails, the zone between 0.618 and 0.66 (the Custom Channel) typically holds as final support.
Applications
- In BTC bull runs, 0.382 bounces have yielded 35%+ gains; breaches signal caution.
Pro Tip: Monitor volume at 0.382 — fading volume suggests exhaustion, increasing reversal odds.
The Custom Channel: High-Probability Reversal Zone
The Custom Channel is the area between 0.618 and 0.66, statistically capturing 68% of bounces where price penetrates 0.618 slightly before reversing at 0.66.
Key Characteristics
- Penetration Tolerance: Allows minor overshoots without invalidating support.
- Confluence Booster: Aligns with other Fib levels for stronger signals.
Applications
- In downtrends, use as resistance for shorts.
- Example: BTC finds support in this channel during corrections, leading to rallies.
Pro Tip: Combine with RSI divergence for confirmation; avoid isolated use in ranging markets.
Fibonacci Confluence: Layering Multiple Tools for Robust Levels
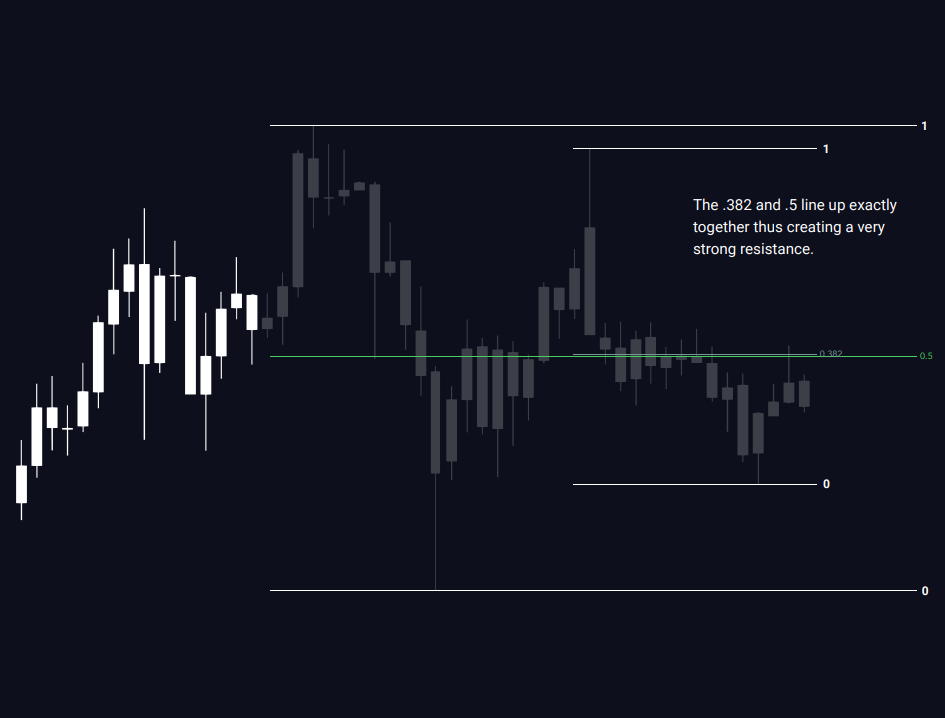
Confluence occurs when multiple Fibonacci draws overlap at similar levels, creating reinforced zones for entries or exits.
Building Confluence
- Draw at least two Fibs from different swings (e.g., daily and 4-hour).
- Look for clusters: 0.382 from one aligning with 0.5 from another.
EMA + Fib Integration (Day Trading)
- Use 26 EMA with Fibs: Below EMA, short bounces to Custom Channel; above, long pullbacks.
- Example: Rejection from weekly level below EMA signals short to channel.
Applications
- Enhances accuracy in volatile assets like crypto; clusters yield 70%+ bounce rates.
Pro Tip: Add volume profile POC for triple confluence — ideal for high-R:R trades.
Negative Fibonacci Levels: Entries and Targets Beyond Standard Ranges
Negative Fibonacci levels extend below 0 or above 1, providing entries and targets for moves outside the initial retracement range.
Common Negative Levels
- -0.236: Minor extension for quick targets.
- -0.618: Moderate support/resistance.
- -1.0: Full inversion point.
- -1.618: Extreme target.
Applications
- From internal retracements, use negatives for external moves.
- Example: In BTC, negative levels from a 0.5 internal top target support after breakdown.
Pro Tip: Verify with other tools like EMAs; negatives excel in trend reversals.
Fibonacci Expansion: Projecting Targets in Impulsive Moves
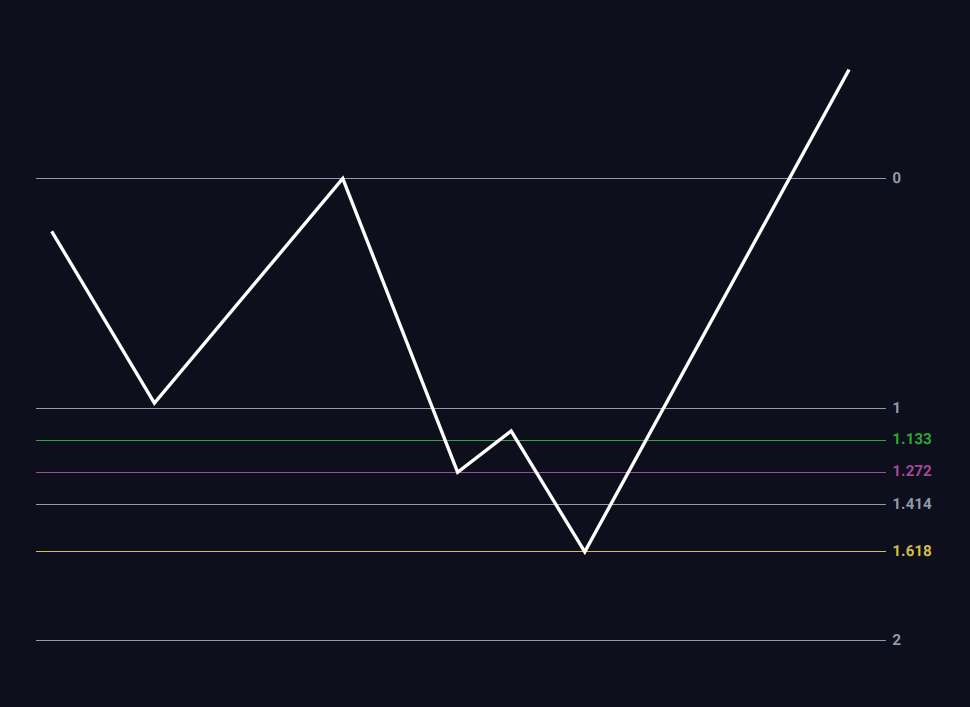
Fibonacci Expansion projects targets for impulsive waves beyond 100%, using three points: low, high, then low/high break.
Common Levels
- 161.8%: Primary target for extensions.
- 261.8%: Secondary in strong trends.
Applications
- Uptrend: From low to high, then pullback low for upside targets.
- Downtrend: Reverse for downside projections.
- Example: BTC breaks prior low; 161.8% targets yield 250% moves.
Pro Tip: Use for harmonic patterns or Elliott Waves; confirm with volume.
Fibonacci Time Extensions: Timing Corrections and Impulses
Fibonacci Time measures temporal extensions from swing points, predicting when moves may end.
Drawing Time Extensions
- From impulsive low to high; extend ratios like 0.618, 1.0, 1.618.
Applications
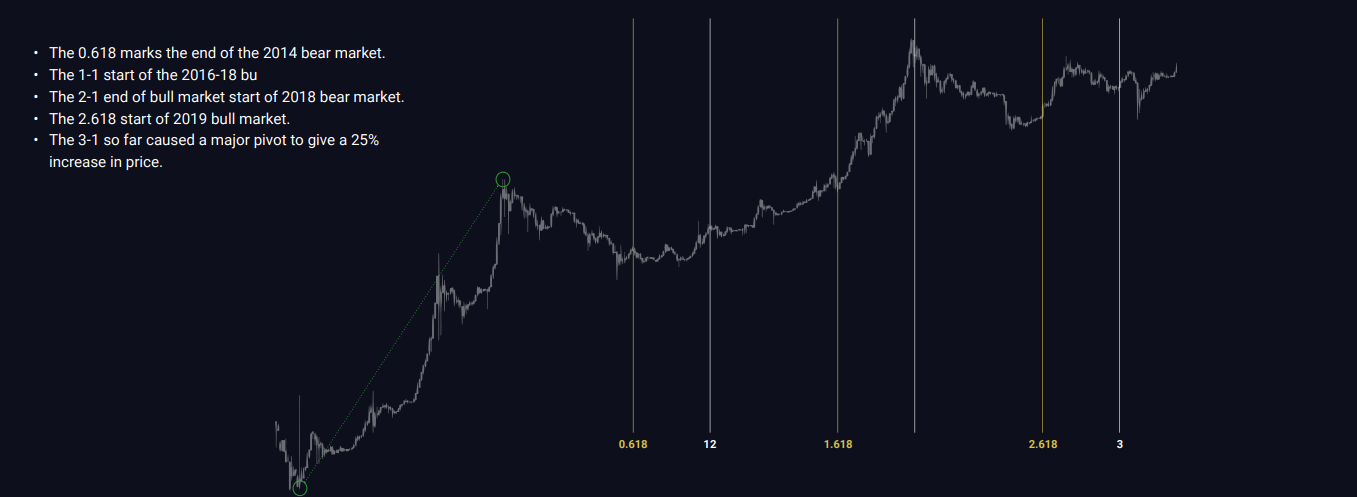
- 0.618: Often ends corrections (e.g., BTC bounces 400% at this extension).
- 1.0: Starts new impulses.
- Example: In BTC cycles, time extensions marked bear market ends and bull starts.
Pro Tip: Use as confluence, not standalone; align with price levels for accuracy.
Advanced Workflow: Confluence, Risk Management, and Optimization
Expert Workflow
- Daily: Draw macro Fibs (weekly/monthly) for bias.
- Intraday: Layer internal/negative for entries.
- Confluence: 3+ levels + EMA/volume for trades.
Risk Management
- Stops: Beyond key Fib (e.g., 1.0 for invalidation).
- Targets: 1.618/2.618 with trailing.
Optimization
- Backtest entries at 0.618 and Custom Channel across multiple assets.
- Combine Fib time + price confluences for highest-probability setups.
Key Resources
- TradingView Fib Tool Guide: https://www.tradingview.com/support/solutions/43000502338/
- Britannica Fibonacci Strategies: https://www.britannica.com/money/fibonacci-trading-strategies
- LuxAlgo Fibonacci Explained: https://www.luxalgo.com/blog/fibonacci-retracements-explained
Further Reading & Resources